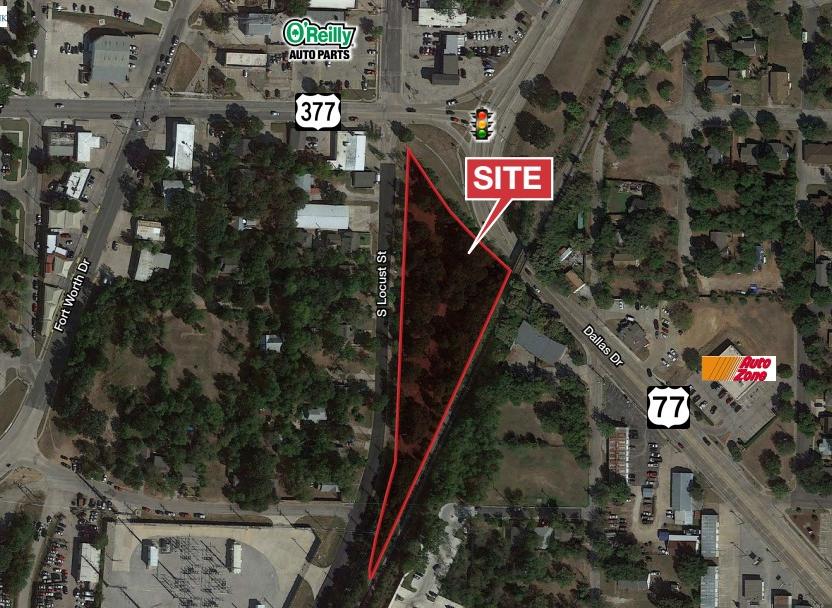
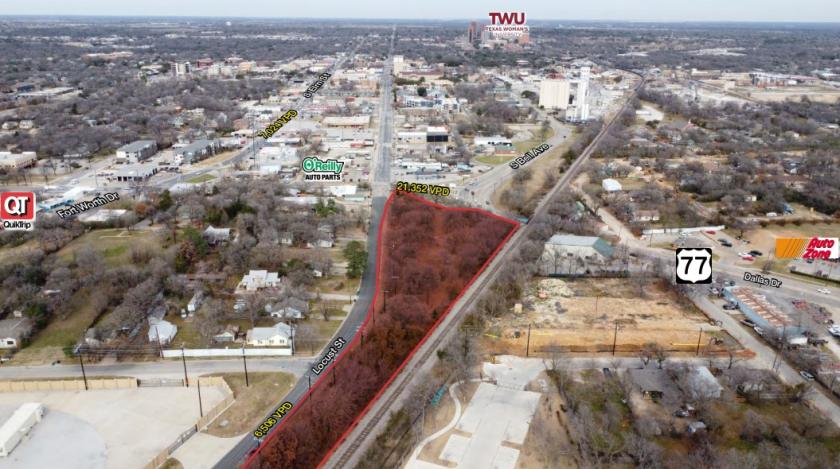
1-Mile | 3-Miles | 5-Miles | ||
---|---|---|---|---|
Total Population | 17,696 | 84,025 | 138,721 | |
Population Median Age | 29 | 33 | 34 | |
Population by Age | 0-9 Yrs | 881 (4%) | 7666 (9%) | 15881 (11%) |
10-19 Yrs | 2488 (14%) | 12895 (15%) | 20302 (14%) | |
20-29 Yrs | 9133 (51%) | 27550 (32%) | 35289 (25%) | |
30-39 Yrs | 2180 (12%) | 10935 (13%) | 19056 (13%) | |
40-49 Yrs | 996 (5%) | 6987 (8%) | 15398 (11%) | |
50-59 Yrs | 1034 (5%) | 7246 (8%) | 13755 (9%) | |
60-69 Yrs | 483 (2%) | 5329 (6%) | 9781 (7%) | |
70+ Yrs | 501 (2%) | 5417 (6%) | 9260 (6%) | |
Median HH Income | $33,166 | $47,018 | $62,023 | |
Total Household Income | < 24K | 2678 (40%) | 7596 (25%) | 8790 (18%) |
25-49K | 1908 (28%) | 7891 (26%) | 10429 (22%) | |
50-74K | 1113 (16%) | 5015 (16%) | 8083 (17%) | |
75-99K | 468 (6%) | 3558 (11%) | 6291 (13%) | |
100-199K | 461 (6%) | 4469 (15%) | 10319 (22%) | |
200K+ | 59 (0%) | 1135 (3%) | 2954 (6%) | |
Highest Education Level | No Diploma | 758 | 4251 | 7823 |
Diploma or GED | 1477 | 8404 | 15142 | |
Some College | 2076 | 11980 | 20446 | |
Assoc. Degree | 487 | 3158 | 5752 | |
Bachelors Degree | 1980 | 11187 | 20208 | |
Higher Degree | 1218 | 7094 | 12116 | |
Total Housing Units | 7,722 | 33,336 | 51,212 | |
--Owner-Occupied | 612 | 10,373 | 23,091 | |
--Renter-Occupied | 6,075 | 19,291 | 23,774 | |
Owner-Occupied Values | < 100K | 101 | 1034 | 2507 |
100-199K | 227 | 3646 | 5877 | |
200-299K | 169 | 3636 | 9407 | |
300-399K | 76 | 1313 | 3551 | |
400-499K | 17 | 301 | 906 | |
500K+ | 21 | 442 | 843 | |
Total Working Age Population | 16,516 | 72,379 | 115,316 | |
In Work Force | 10,960 | 48,593 | 78,914 | |
Not In Work Force | 5,556 | 23,786 | 36,402 | |
Workforce Employed | 10,175 | 45,664 | 74,990 | |
Workforce Unemployed | 764 | 2,879 | 3,857 | |
Civlian Workforce | 10,938 | 48,543 | 78,847 | |
Military Workforce | 22 | 50 | 67 | |
Total Households | 6,687 | 29,664 | 46,865 | |
Family Households | 1,748 | 14,475 | 27,655 | |
Non-Family Households | 4,939 | 15,188 | 19,210 | |
Married Couple | 961 | 9,517 | 20,426 | |
Other Family | 788 | 4,958 | 7,229 | |
Married w/Child | 336 | 3,750 | 9,407 | |
Single Male w/Child | 45 | 541 | 733 | |
Single Female w/Child | 279 | 1,803 | 2,668 |
Population Change Last Two Decades - Plus Projection
2000 | % | 2010 | % | 2020 | % | 2030 | |
---|---|---|---|---|---|---|---|
Texas | 20,851,820 | +21 | 25,145,561 | +18 | 29,677,668 | +18 | 34,894,452 |
Denton County | 432,976 | +53 | 662,614 | +36 | 897,953 | +37 | 1,234,110 |
Total Working Age Population:
Total Households:
Total Working Age Population:
Total Households:
Total Working Age Population:
Total Households: