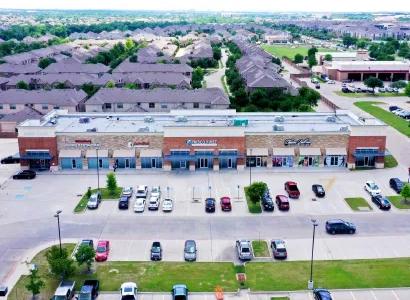
1-Mile | 3-Miles | 5-Miles | ||
---|---|---|---|---|
Total Population | 12,947 | 112,740 | 297,868 | |
Population Median Age | 33 | 36 | 37 | |
Population by Age | 0-9 Yrs | 1795 (13%) | 13076 (11%) | 36329 (12%) |
10-19 Yrs | 1551 (11%) | 15525 (13%) | 41995 (14%) | |
20-29 Yrs | 1935 (14%) | 14446 (12%) | 34754 (11%) | |
30-39 Yrs | 3034 (23%) | 18036 (15%) | 43708 (14%) | |
40-49 Yrs | 1978 (15%) | 20364 (18%) | 51691 (17%) | |
50-59 Yrs | 1494 (11%) | 15923 (14%) | 41974 (14%) | |
60-69 Yrs | 680 (5%) | 9006 (7%) | 27551 (9%) | |
70+ Yrs | 480 (3%) | 6364 (5%) | 19864 (6%) | |
Median HH Income | $110,378 | $104,278 | $110,350 | |
Total Household Income | < 24K | 279 (5%) | 3728 (8%) | 8101 (7%) |
25-49K | 475 (9%) | 5337 (11%) | 13438 (11%) | |
50-74K | 552 (10%) | 5832 (13%) | 14524 (12%) | |
75-99K | 841 (16%) | 6437 (14%) | 14304 (12%) | |
100-199K | 2305 (44%) | 15570 (34%) | 39014 (34%) | |
200K+ | 746 (14%) | 7731 (17%) | 22992 (20%) | |
Highest Education Level | No Diploma | 283 | 2312 | 7478 |
Diploma or GED | 764 | 7470 | 20710 | |
Some College | 919 | 10991 | 31776 | |
Assoc. Degree | 361 | 4583 | 13517 | |
Bachelors Degree | 3633 | 30830 | 79011 | |
Higher Degree | 2952 | 20871 | 51326 | |
Total Housing Units | 5,833 | 47,816 | 119,018 | |
--Owner-Occupied | 1,922 | 21,875 | 66,742 | |
--Renter-Occupied | 3,275 | 22,759 | 45,630 | |
Owner-Occupied Values | < 100K | 38 | 246 | 737 |
100-199K | 24 | 523 | 3483 | |
200-299K | 337 | 4040 | 13198 | |
300-399K | 697 | 7482 | 19692 | |
400-499K | 533 | 4795 | 12575 | |
500K+ | 292 | 4788 | 17056 | |
Total Working Age Population | 10,070 | 89,564 | 234,655 | |
In Work Force | 7,491 | 64,516 | 167,580 | |
Not In Work Force | 2,578 | 25,048 | 67,075 | |
Workforce Employed | 7,173 | 61,780 | 161,061 | |
Workforce Unemployed | 289 | 2,613 | 6,371 | |
Civlian Workforce | 7,462 | 64,393 | 167,432 | |
Military Workforce | 29 | 123 | 148 | |
Total Households | 5,197 | 44,635 | 112,372 | |
Family Households | 3,281 | 29,431 | 79,090 | |
Non-Family Households | 1,916 | 15,204 | 33,282 | |
Married Couple | 2,963 | 24,746 | 67,280 | |
Other Family | 318 | 4,684 | 11,810 | |
Married w/Child | 1,970 | 14,161 | 35,394 | |
Single Male w/Child | 35 | 556 | 1,386 | |
Single Female w/Child | 97 | 1,759 | 4,862 |
Population Change Last Two Decades - Plus Projection
2000 | % | 2010 | % | 2020 | % | 2030 | |
---|---|---|---|---|---|---|---|
Texas | 20,851,820 | +21 | 25,145,561 | +18 | 29,677,668 | +18 | 34,894,452 |
Denton County | 432,976 | +53 | 662,614 | +36 | 897,953 | +37 | 1,234,110 |
Collin County | 491,675 | +59 | 782,341 | +33 | 1,039,369 | +34 | 1,391,461 |
Total Working Age Population:
Total Households:
Total Working Age Population:
Total Households:
Total Working Age Population:
Total Households: