Industrial Properties
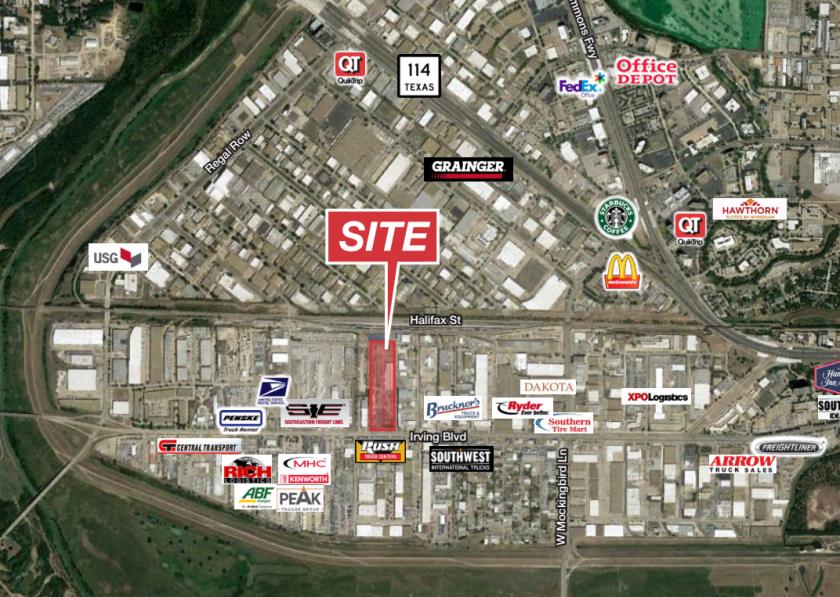
4001 Irving Boulevard Dallas, TX 75247
4001 Irving Boulevard Dallas, TX 75247

Details & Description
Property Highlights
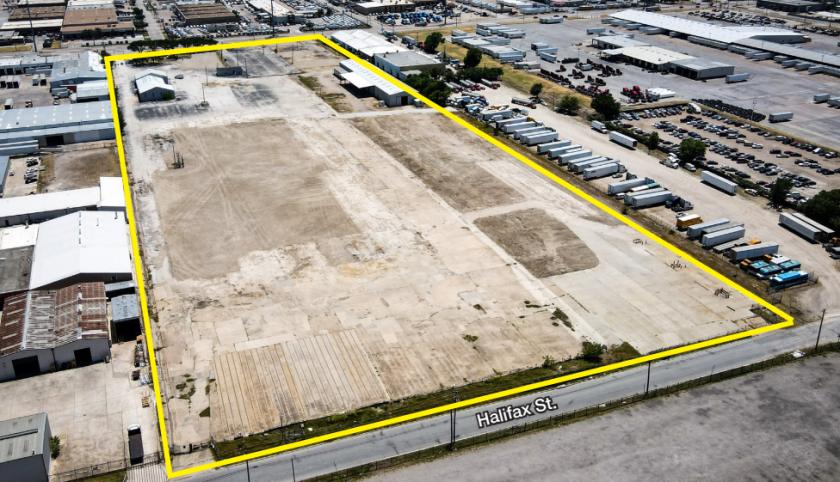
- • For Lease 5-19.2 Acres
- • Number of Buildings: 2
- • Building SF: 10,250 SF & 18,000 SF
- • Ceiling Heights: 20’-25’
- • Grade Level Loading - Maintenance
- • Rail Served by Dallas, Garland, and Northeastern
Listing Agents

Matt Elliott
O: 214-256-7161
M: 214-256-7161
melliott@nairl.com
O: 214-256-7161
M: 214-256-7161
melliott@nairl.com

Rick Medinis
O: 214-543-1248
M: 214-256-7116
rmedinis@nairl.com
O: 214-543-1248
M: 214-256-7116
rmedinis@nairl.com
While we strive to provide the most accurate information, all listing information, and demographic data, is provided by third-parties. As such, MyEListing will not be responsible for the accuracy of the information. It is strongly recommended that you verify all information with the listing agent, and any relevant agencies, prior to making any decisions.