Commercial Land
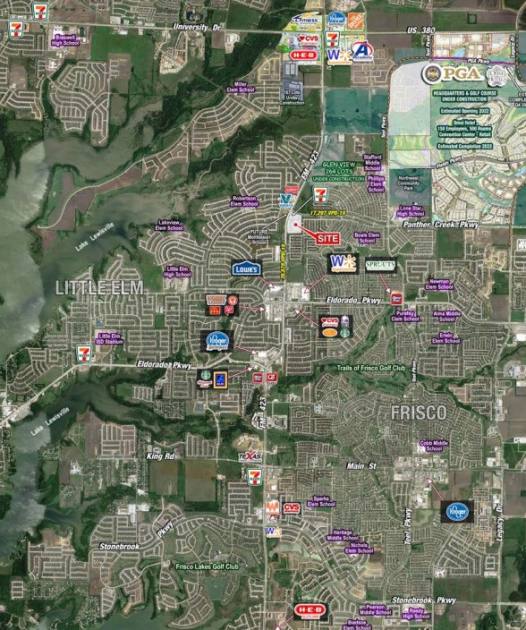
SEC FM 423 and Panther Creek Frisco, TX 75034
SEC FM 423 and Panther Creek Frisco, TX 75034

Details & Description
Property Highlights
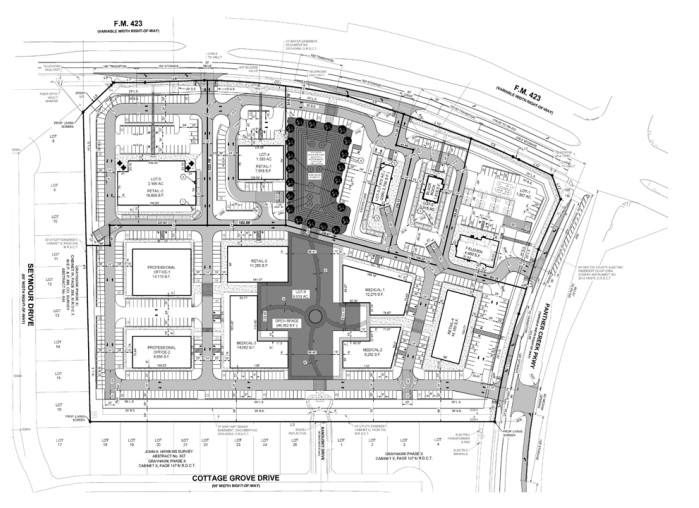
• Approximately 15.3 acres available for ground lease or purchase
• Traffic Counts: Panther Creek: 17,297 VPD (2019)
Listing Agents

Daniel Frid
O: 214-960-4545
M: 214-501-5108
dfrid@shopcompanies.com
O: 214-960-4545
M: 214-501-5108
dfrid@shopcompanies.com

Max Keffer
O: 214-960-4545
M: 214-960-1042
max@shopcompanies.com
O: 214-960-4545
M: 214-960-1042
max@shopcompanies.com
While we strive to provide the most accurate information, all listing information, and demographic data, is provided by third-parties. As such, MyEListing will not be responsible for the accuracy of the information. It is strongly recommended that you verify all information with the listing agent, and any relevant agencies, prior to making any decisions.