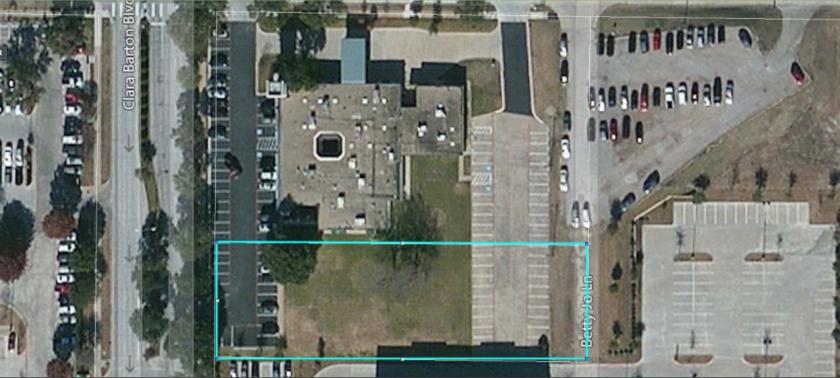
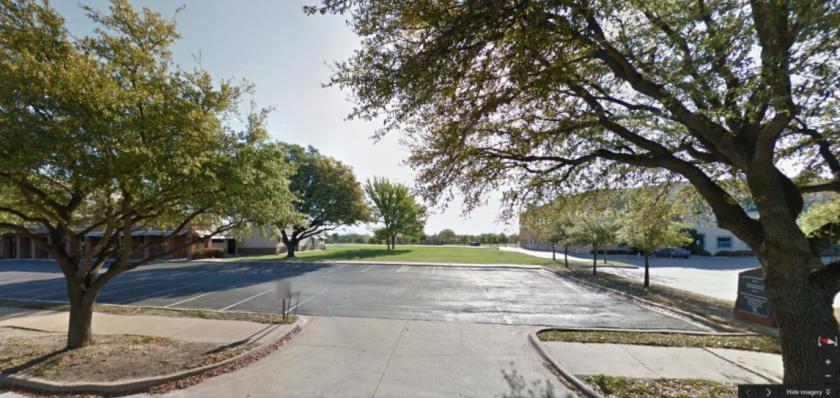
1-Mile | 3-Miles | 5-Miles | ||
---|---|---|---|---|
Total Population | 15,661 | 137,049 | 365,779 | |
Population Median Age | 33 | 35 | 36 | |
Population by Age | 0-9 Yrs | 2767 (17%) | 19978 (14%) | 55364 (15%) |
10-19 Yrs | 2617 (16%) | 21260 (15%) | 49284 (13%) | |
20-29 Yrs | 2256 (14%) | 19399 (14%) | 55015 (15%) | |
30-39 Yrs | 2002 (12%) | 18706 (13%) | 53005 (14%) | |
40-49 Yrs | 2025 (12%) | 17766 (12%) | 47572 (13%) | |
50-59 Yrs | 2016 (12%) | 17342 (12%) | 44889 (12%) | |
60-69 Yrs | 987 (6%) | 12317 (8%) | 34241 (9%) | |
70+ Yrs | 990 (6%) | 10281 (7%) | 26411 (7%) | |
Median HH Income | $47,253 | $53,442 | $56,307 | |
Total Household Income | < 24K | 889 (20%) | 7874 (18%) | 23264 (18%) |
25-49K | 1456 (33%) | 11716 (27%) | 32796 (25%) | |
50-74K | 822 (19%) | 9166 (21%) | 24607 (19%) | |
75-99K | 541 (12%) | 5555 (13%) | 15435 (12%) | |
100-199K | 595 (13%) | 7044 (16%) | 24895 (19%) | |
200K+ | 18 (0%) | 777 (1%) | 5952 (4%) | |
Highest Education Level | No Diploma | 3370 | 24574 | 48119 |
Diploma or GED | 2231 | 21354 | 51651 | |
Some College | 1719 | 18882 | 51955 | |
Assoc. Degree | 533 | 5095 | 15724 | |
Bachelors Degree | 962 | 11819 | 46881 | |
Higher Degree | 300 | 4262 | 21025 | |
Total Housing Units | 4,625 | 44,699 | 135,995 | |
--Owner-Occupied | 2,294 | 25,242 | 68,321 | |
--Renter-Occupied | 2,027 | 16,892 | 58,627 | |
Owner-Occupied Values | < 100K | 536 | 6286 | 10808 |
100-199K | 1507 | 14577 | 31745 | |
200-299K | 204 | 3731 | 14453 | |
300-399K | 40 | 413 | 6464 | |
400-499K | 1 | 97 | 2545 | |
500K+ | 7 | 137 | 2307 | |
Total Working Age Population | 11,364 | 104,644 | 280,435 | |
In Work Force | 7,611 | 69,788 | 195,209 | |
Not In Work Force | 3,754 | 34,856 | 85,225 | |
Workforce Employed | 7,110 | 65,296 | 184,243 | |
Workforce Unemployed | 460 | 4,430 | 10,853 | |
Civlian Workforce | 7,570 | 69,726 | 195,096 | |
Military Workforce | 40 | 62 | 113 | |
Total Households | 4,321 | 42,133 | 126,948 | |
Family Households | 3,416 | 31,458 | 87,680 | |
Non-Family Households | 905 | 10,676 | 39,267 | |
Married Couple | 2,194 | 21,647 | 60,951 | |
Other Family | 1,221 | 9,810 | 26,730 | |
Married w/Child | 1,140 | 9,903 | 27,547 | |
Single Male w/Child | 211 | 1,267 | 3,247 | |
Single Female w/Child | 453 | 3,365 | 10,515 |
Population Change Last Two Decades - Plus Projection
2000 | % | 2010 | % | 2020 | % | 2030 | |
---|---|---|---|---|---|---|---|
Texas | 20,851,820 | +21 | 25,145,561 | +18 | 29,677,668 | +18 | 34,894,452 |
Dallas County | 2,218,899 | +7 | 2,368,139 | +15 | 2,734,111 | +14 | 3,106,298 |
Collin County | 491,675 | +59 | 782,341 | +33 | 1,039,369 | +34 | 1,391,461 |
Total Working Age Population:
Total Households:
Total Working Age Population:
Total Households:
Total Working Age Population:
Total Households: