Retail Space
Mesquite Commons Mesquite, TX 75150
Mesquite Commons Mesquite, TX 75150
Details & Description
Property Highlights
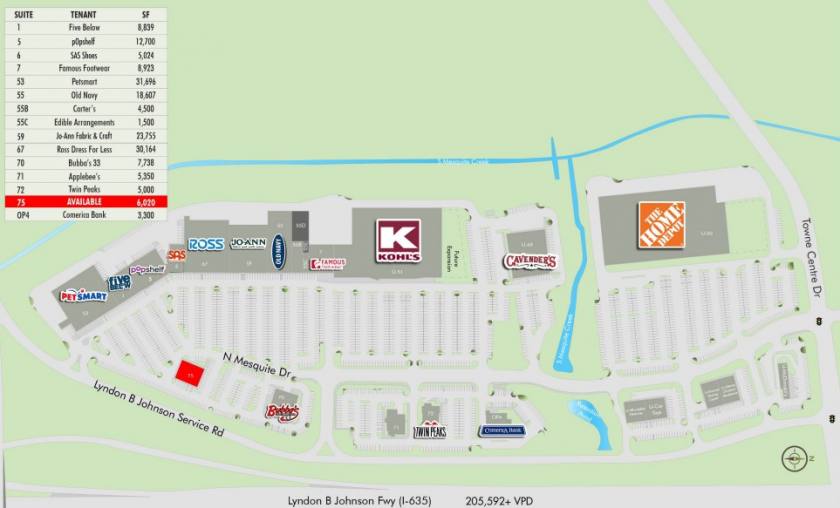
- • 196,598 SF Power Center
- • Junior anchor and Pad opportunity available
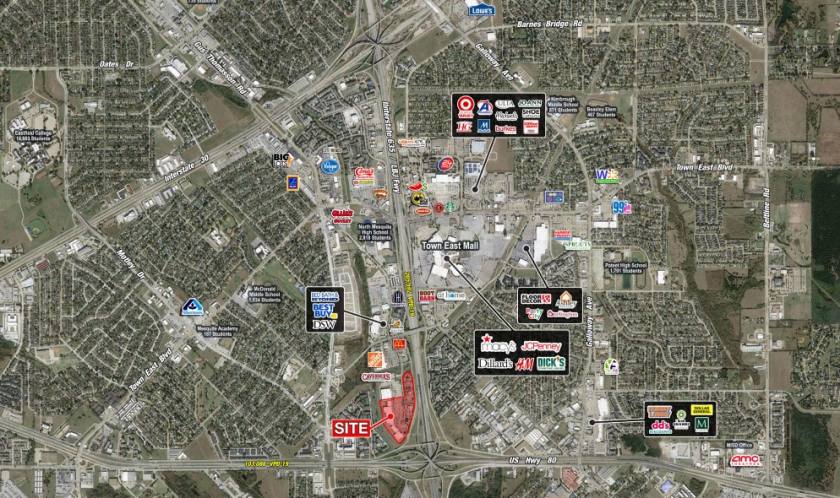
- • Traffic Counts: Interstate 635 205,592 VPD-19
- • Traffic Counts: US Hwy 80 103,086 VPD-19
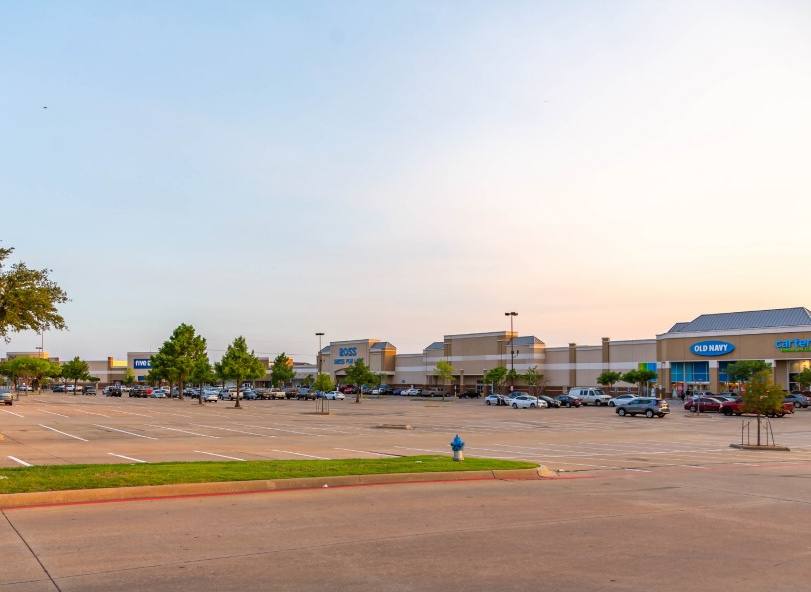
Additional Photos

Listing Agents

Daniel Frid
O: 214-960-4545
M: 214-501-5108
dfrid@shopcompanies.com
O: 214-960-4545
M: 214-501-5108
dfrid@shopcompanies.com
While we strive to provide the most accurate information, all listing information, and demographic data, is provided by third-parties. As such, MyEListing will not be responsible for the accuracy of the information. It is strongly recommended that you verify all information with the listing agent, and any relevant agencies, prior to making any decisions.


