Industrial Properties
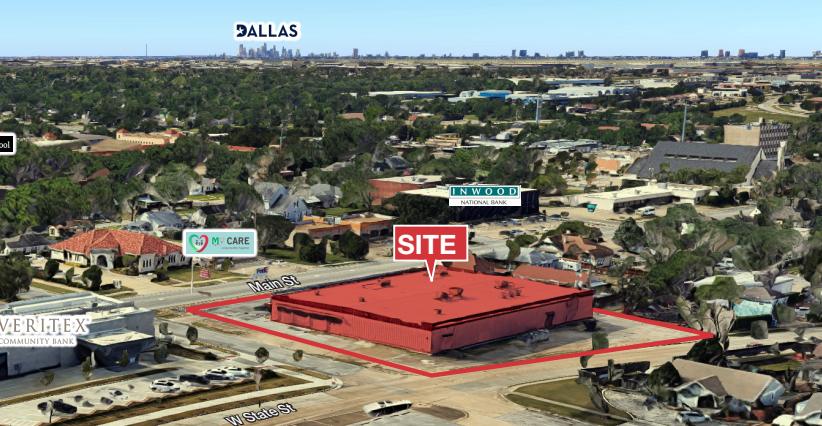
1101 Main Street Garland, TX 75040
1101 Main Street Garland, TX 75040
Details & Description
Property Highlights
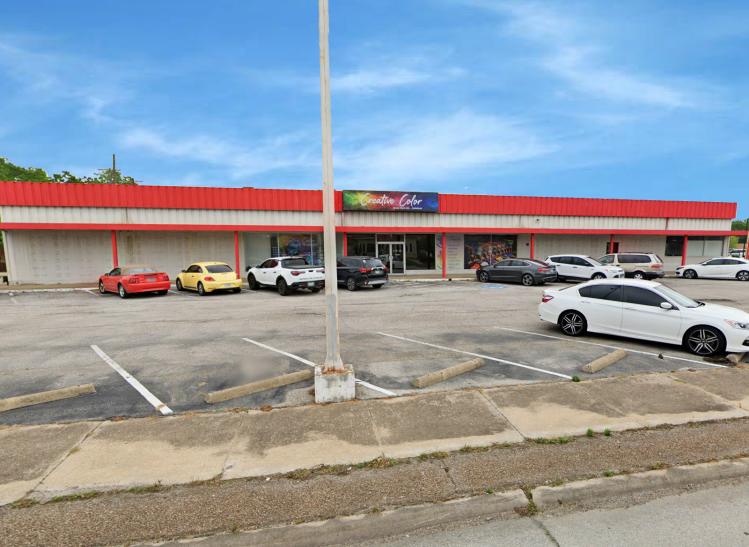
- • Freestanding Grade Level Office Warehouse
- • 1,000 SF Office
- • 14’ Clear Height
- • Four (4) Grade Level Doors
- • One (1) Dock Door
- • Located in the Heart of Garland Industrial Area
Listing Agents

Chase Miller
O: 214-256-7131
M: 214-770-5495
cmiller@nairl.com
O: 214-256-7131
M: 214-770-5495
cmiller@nairl.com
Robert Blankinship
O: 214-256-7115
M: 214-500-6326
rblankinship@nairl.com
O: 214-256-7115
M: 214-500-6326
rblankinship@nairl.com

Stephen Cooper
O: 214-256-7160
M: 214-497-0730
scooper@nairl.com
O: 214-256-7160
M: 214-497-0730
scooper@nairl.com
While we strive to provide the most accurate information, all listing information, and demographic data, is provided by third-parties. As such, MyEListing will not be responsible for the accuracy of the information. It is strongly recommended that you verify all information with the listing agent, and any relevant agencies, prior to making any decisions.