Industrial Properties
10835 Sanden Drive Dallas, TX 75238
10835 Sanden Drive Dallas, TX 75238

Details & Description
Property Highlights
- • Sprinklered
- • Clear Height: 20’
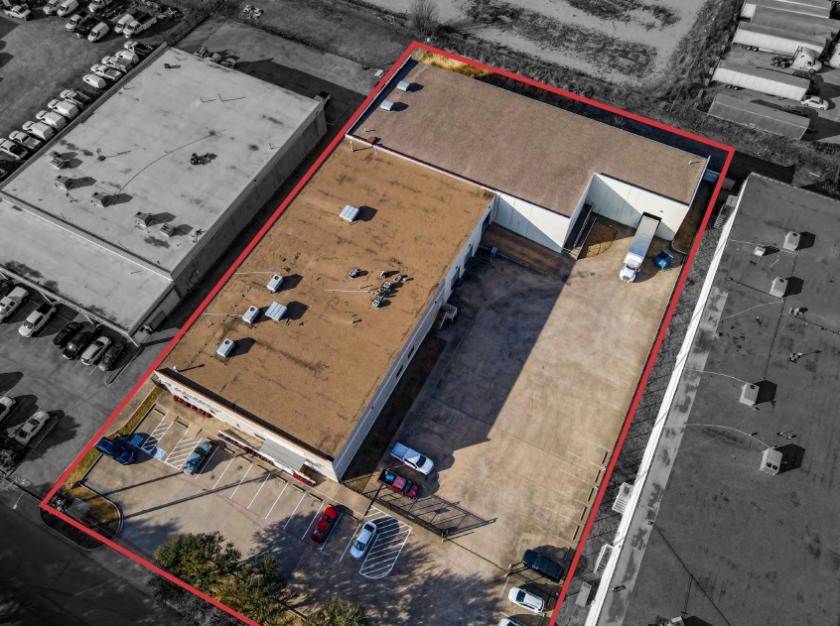
- • Outside Storage
- • Parking Ratio: .98/1,000
- • Office: 8,811 SF
- • Loading: Rear Load
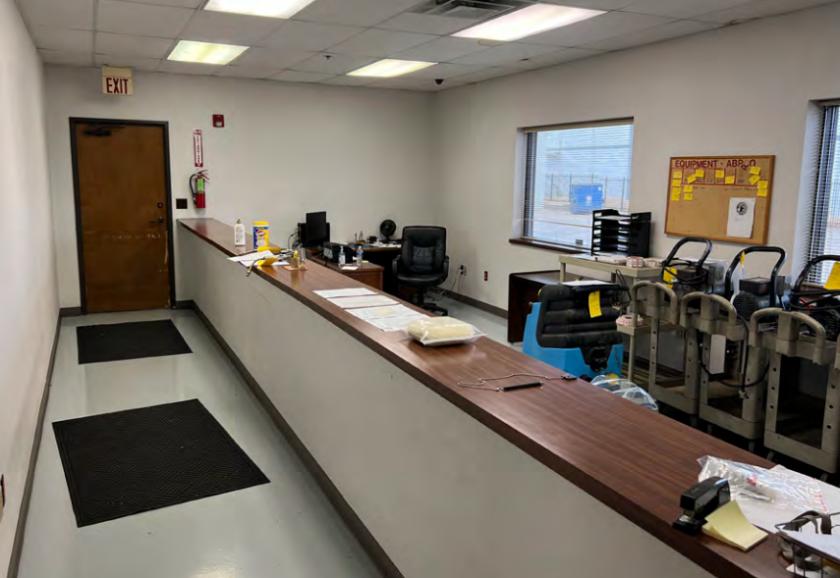
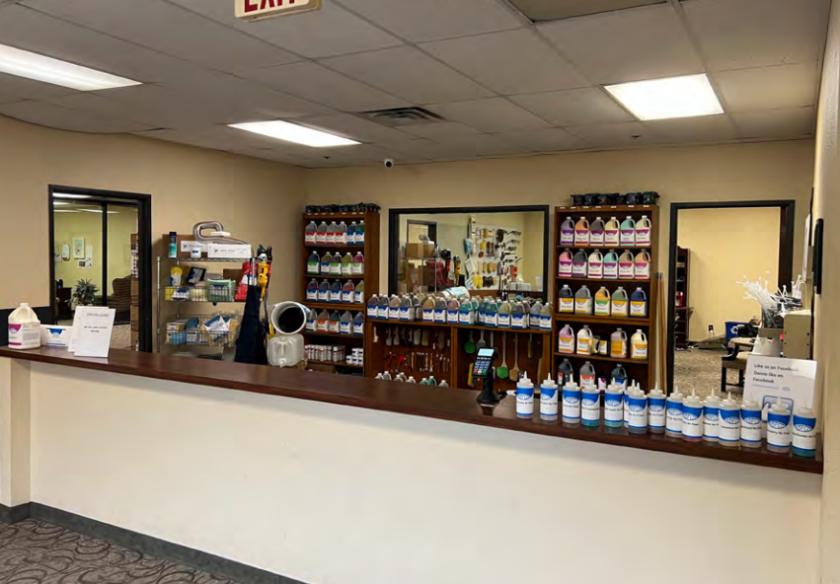
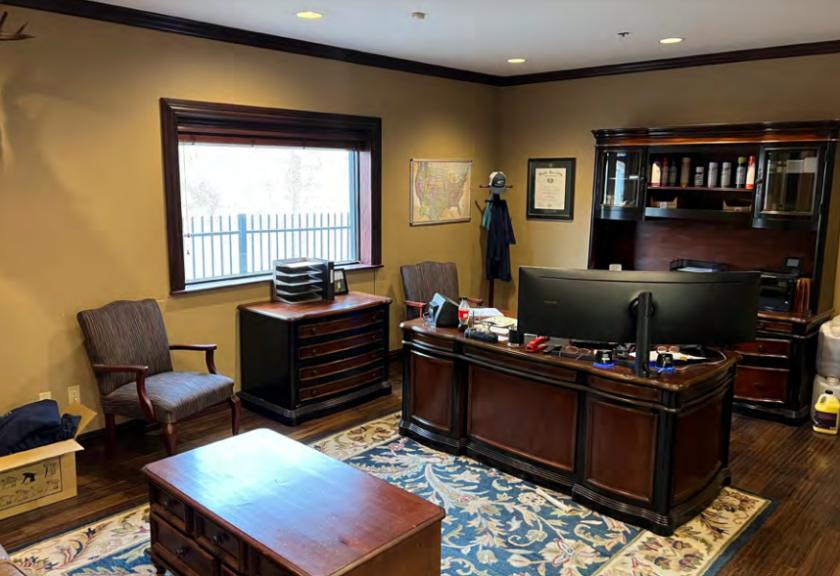
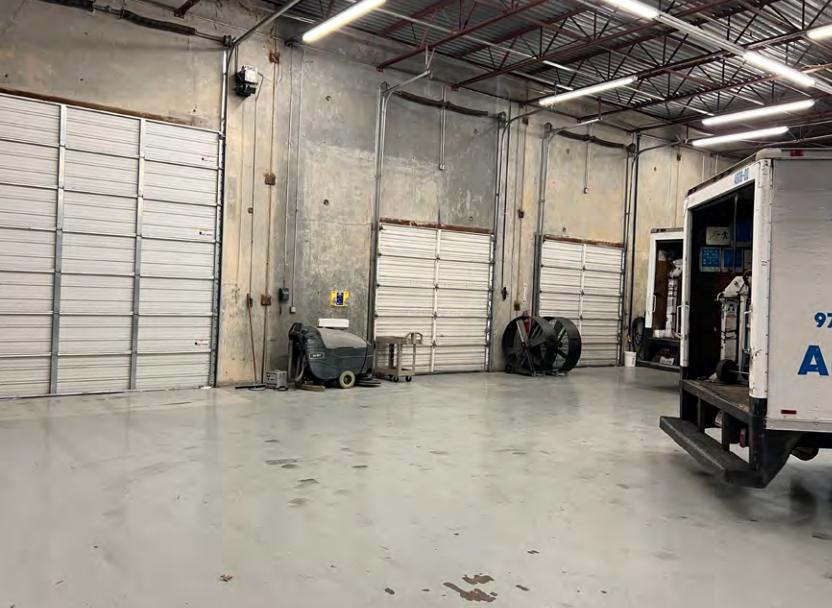
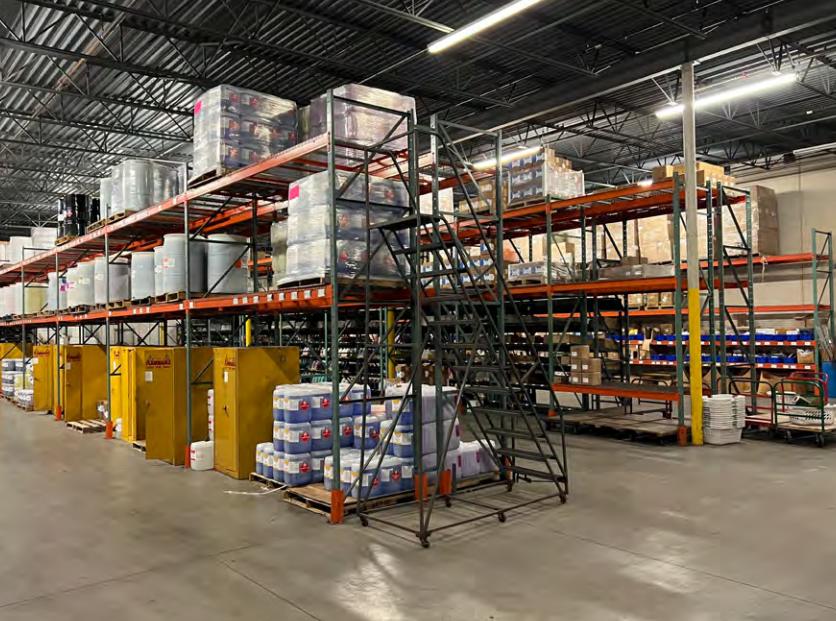
Additional Photos

Listing Agents

Dave Peterson
O: 214-256-7129
M: 972-922-5680
dpeterson@nairl.com
O: 214-256-7129
M: 972-922-5680
dpeterson@nairl.com
While we strive to provide the most accurate information, all listing information, and demographic data, is provided by third-parties. As such, MyEListing will not be responsible for the accuracy of the information. It is strongly recommended that you verify all information with the listing agent, and any relevant agencies, prior to making any decisions.