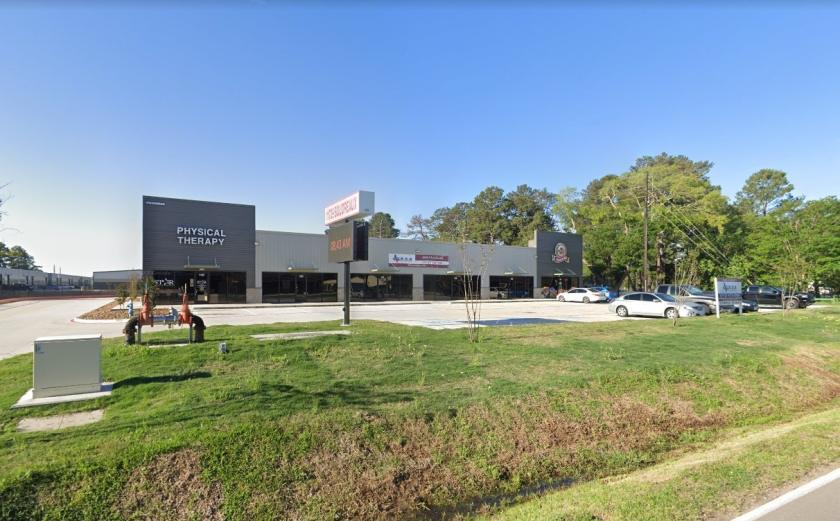
Retail Space
11709 Boudreaux Road Tomball, TX 77375
11709 Boudreaux Road Tomball, TX 77375
Details & Description
Property Highlights
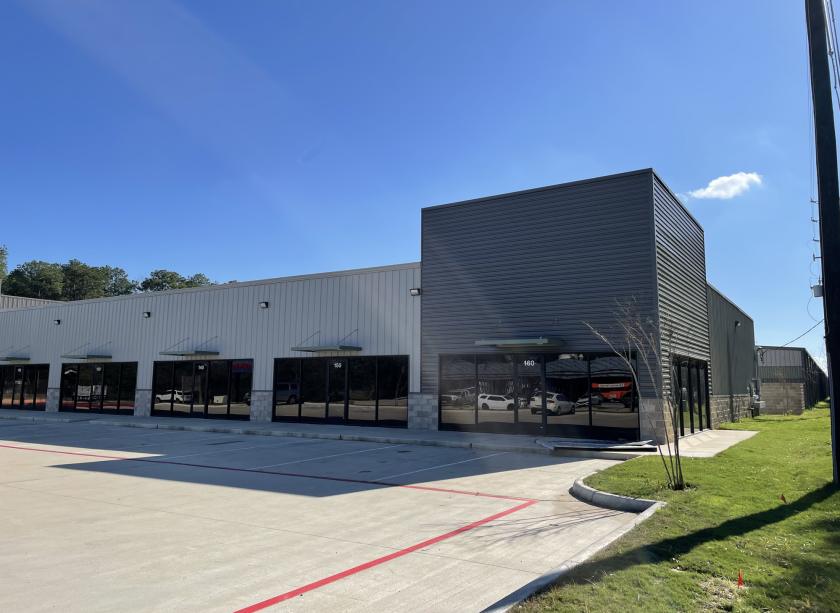
• Excellent Business / Retail Opportunity in Tomball, TX. Available for immediate build-out and move in.
• LL Standard Buildout will include HVAC, demising wall, restroom drop celling or drop lighting
Listing Agents

Tracy Eddy
O: 713-473-7200
M: 713-907-1707
tracy@texascres.com
O: 713-473-7200
M: 713-907-1707
tracy@texascres.com
While we strive to provide the most accurate information, all listing information, and demographic data, is provided by third-parties. As such, MyEListing will not be responsible for the accuracy of the information. It is strongly recommended that you verify all information with the listing agent, and any relevant agencies, prior to making any decisions.