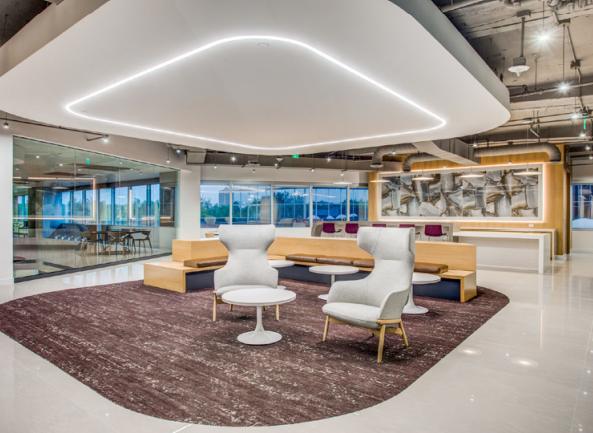
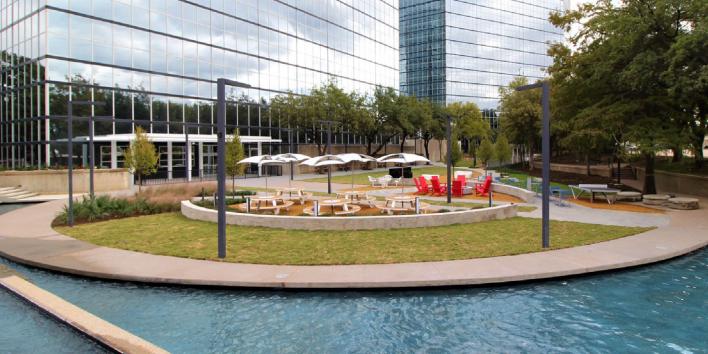
Office Space
5400 Lyndon B Johnson Freeway Dallas, TX 75240
5400 Lyndon B Johnson Freeway Dallas, TX 75240
Details & Description
Property Highlights
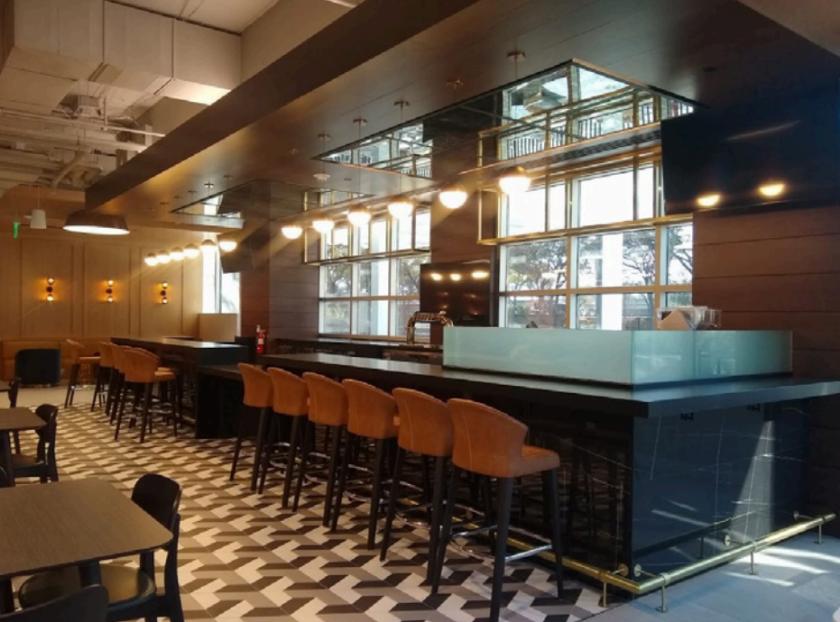
- • Starbucks Cafe
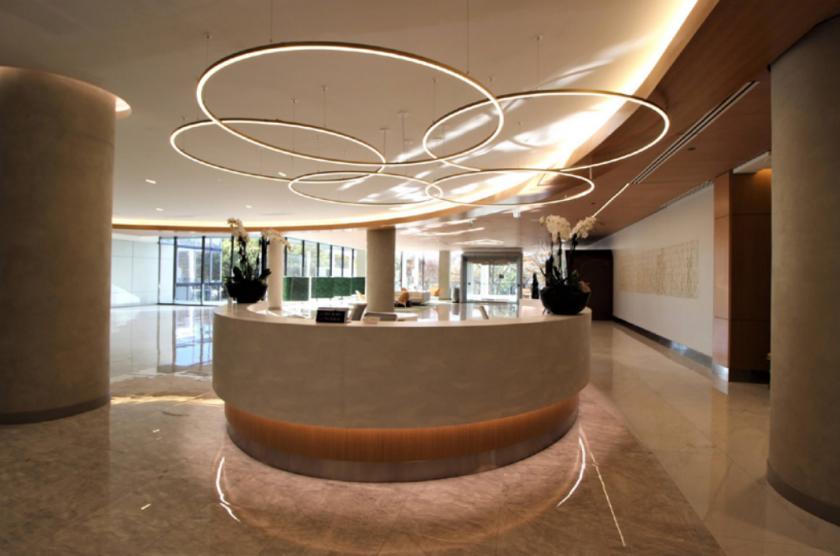
- • Concierge Service
- • 24 Hour Security
- • Garage and Executive Parking
- • Cleaner/Laundry
- • New Food Hall
Additional Photos

Listing Agents

Walker Hume
O: 214-256-7153
M: 214-205-7102
whume@nairl.com
O: 214-256-7153
M: 214-205-7102
whume@nairl.com
While we strive to provide the most accurate information, all listing information, and demographic data, is provided by third-parties. As such, MyEListing will not be responsible for the accuracy of the information. It is strongly recommended that you verify all information with the listing agent, and any relevant agencies, prior to making any decisions.