Retail Space
111 South 8th Street La Porte, TX 77571
111 South 8th Street La Porte, TX 77571

Details & Description
Property Highlights
• $17.00 Rate is base rent per square foot per year
• $5.50 NNN per square foot per year
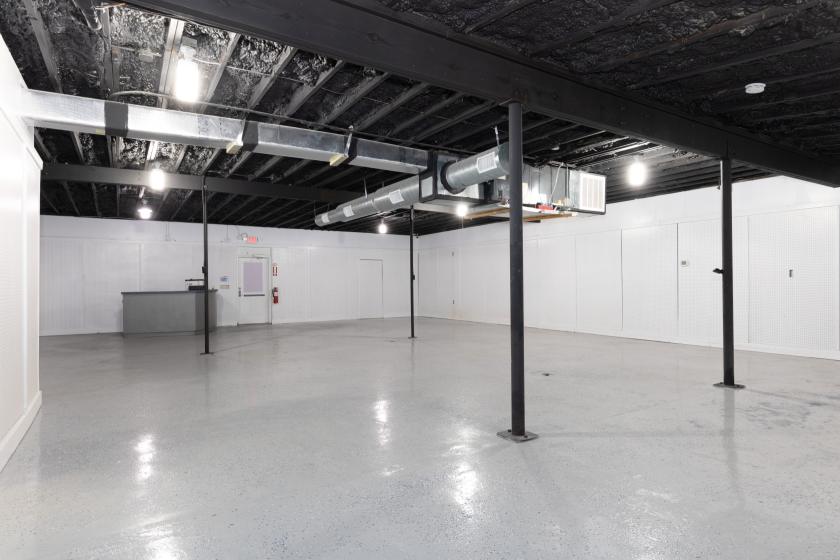
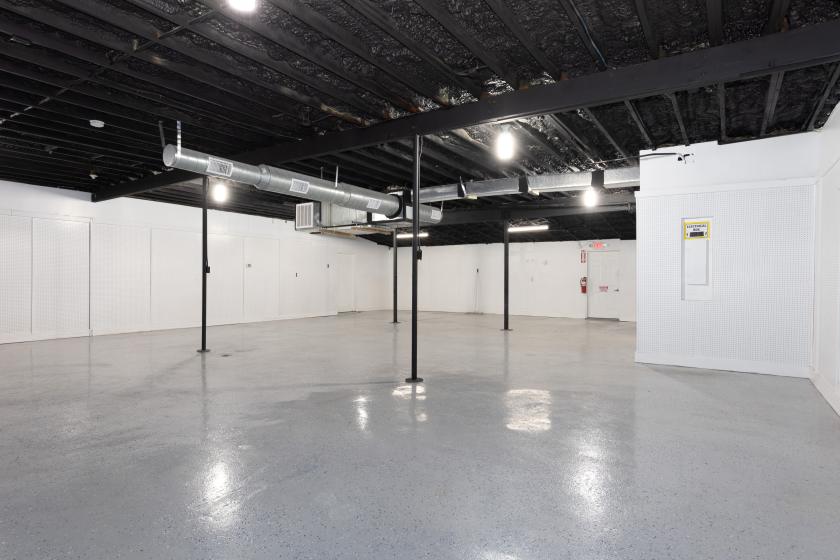
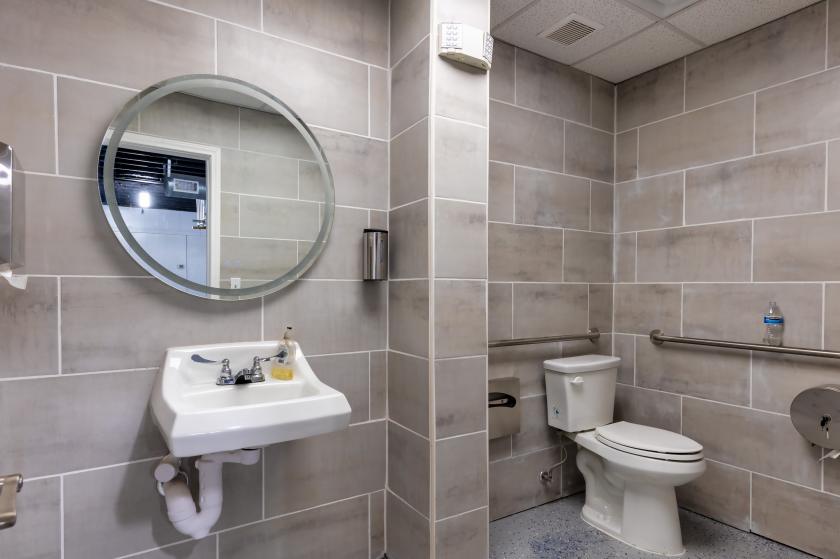
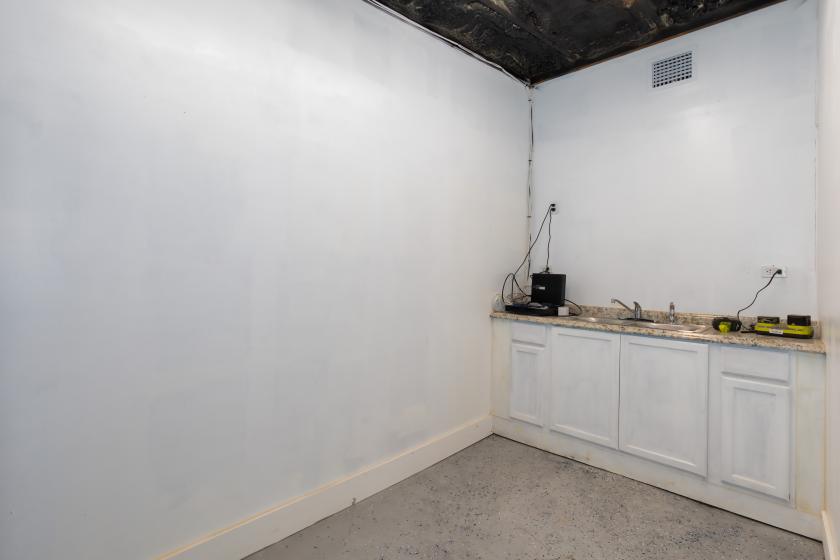
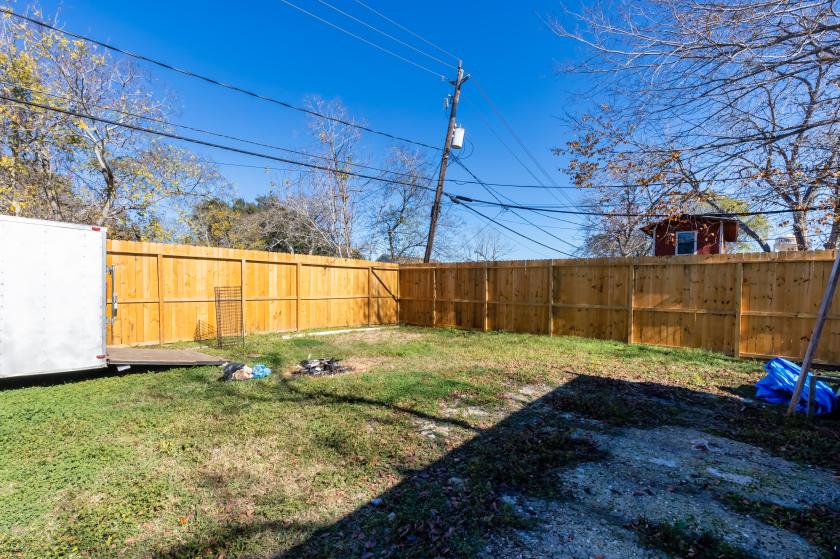
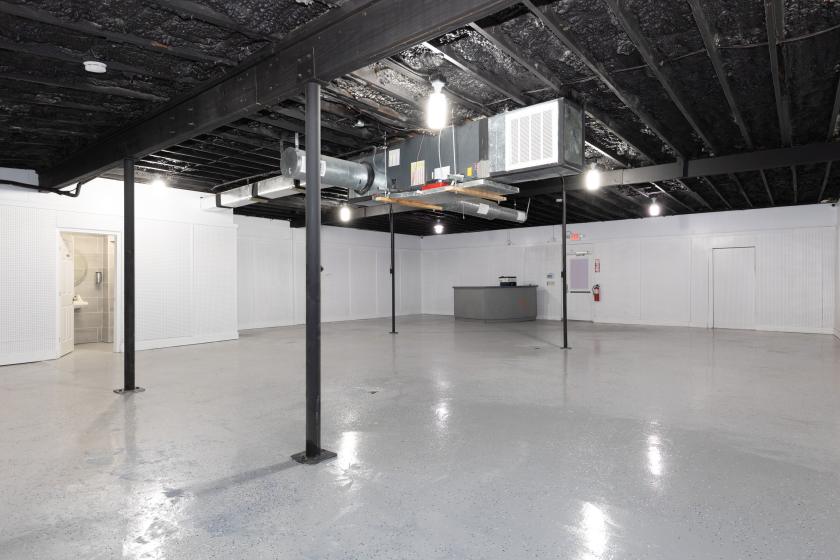
Additional Photos


Listing Agents

Mickey Patel
O: 832-244-6830
M: 832-244-6830
mickey@mpr.group
O: 832-244-6830
M: 832-244-6830
mickey@mpr.group
While we strive to provide the most accurate information, all listing information, and demographic data, is provided by third-parties. As such, MyEListing will not be responsible for the accuracy of the information. It is strongly recommended that you verify all information with the listing agent, and any relevant agencies, prior to making any decisions.