Retail Space
11403 Barker Cypress Road Cypress, TX 77433
11403 Barker Cypress Road Cypress, TX 77433

Details & Description
Property Highlights
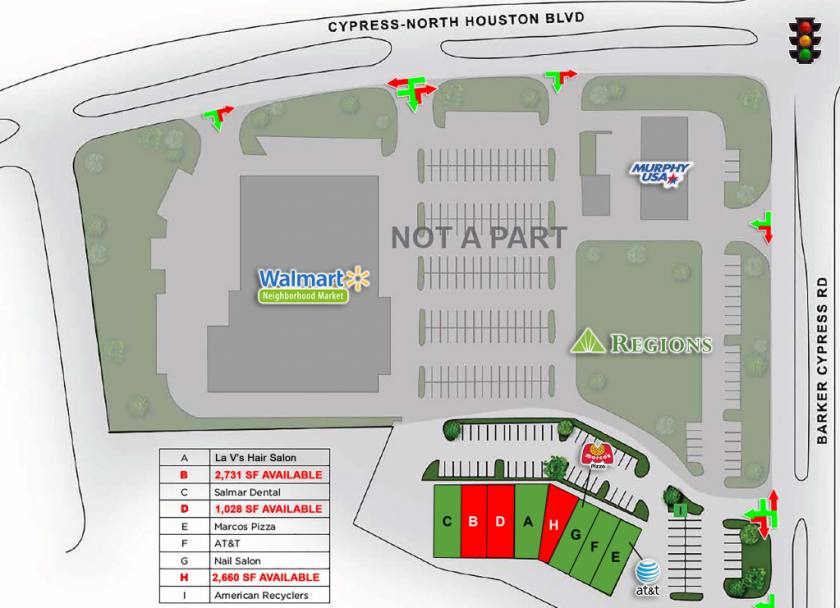
• Availability: a 1,028 sf postal center, a 2,731 SF former yoga studio, and a 2,660 SF former massage space available.
• Centrally located between Towne Lake, Alder Trails, and Riata West subdivisions.
Listing Agents

Haley Golden
O: 713-664-3634
M: 713-705-6808
hgolden@evergreencommrealty.com
O: 713-664-3634
M: 713-705-6808
hgolden@evergreencommrealty.com
While we strive to provide the most accurate information, all listing information, and demographic data, is provided by third-parties. As such, MyEListing will not be responsible for the accuracy of the information. It is strongly recommended that you verify all information with the listing agent, and any relevant agencies, prior to making any decisions.