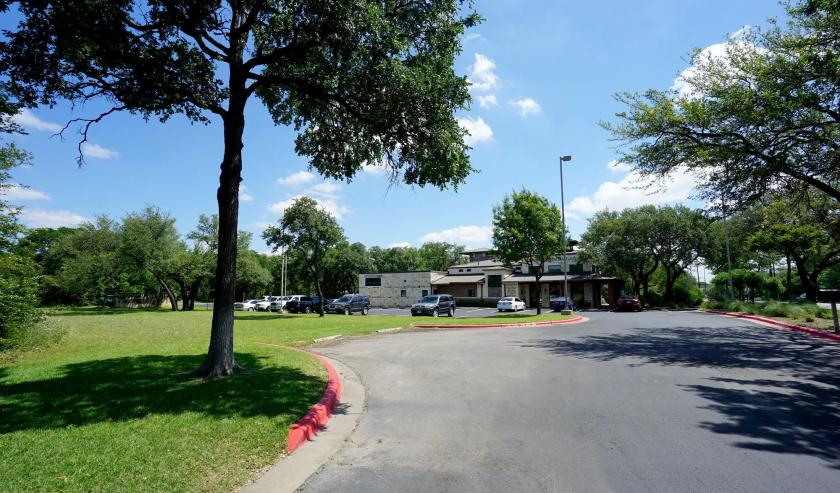
Office Space
6500 McNeil Drive Austin, TX 78729
6500 McNeil Drive Austin, TX 78729
Details & Description
Property Highlights
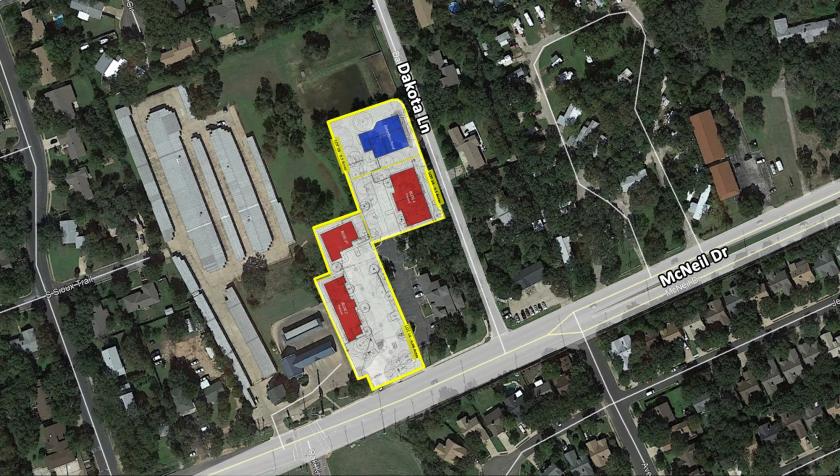
• Located on the NW corner of McNeil Dr and Dakota Ln just one mile east of HWY 183
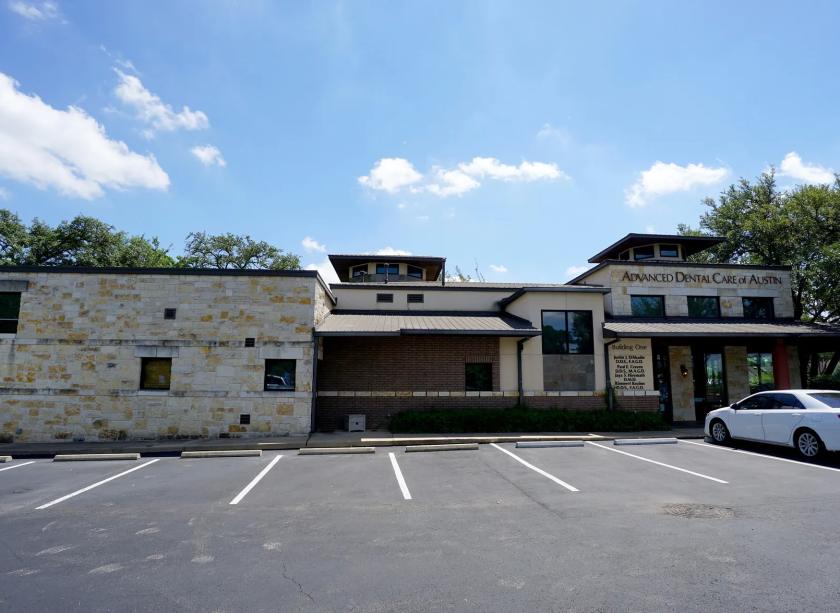
• General or medical office use
Listing Agents

Brent Campbell
O: 512-814-1814
brent@donquick.com
O: 512-814-1814
brent@donquick.com
While we strive to provide the most accurate information, all listing information, and demographic data, is provided by third-parties. As such, MyEListing will not be responsible for the accuracy of the information. It is strongly recommended that you verify all information with the listing agent, and any relevant agencies, prior to making any decisions.