Office Space
12731 Research Boulevard Austin, TX 78759
12731 Research Boulevard Austin, TX 78759
Details & Description
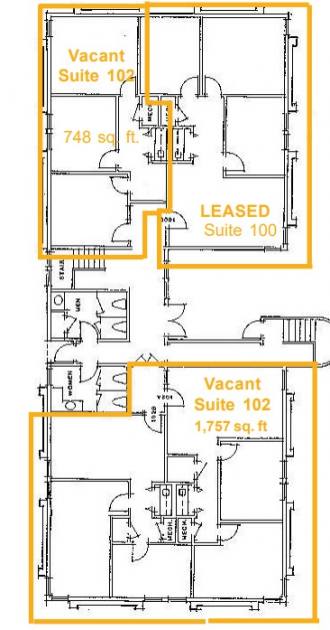
Property Highlights
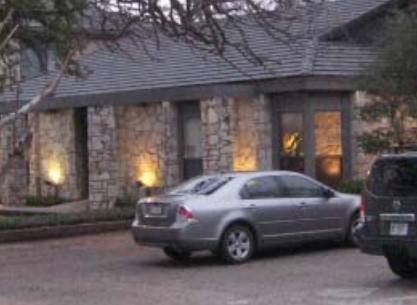
• Location: The property is located at 12731 Research Blvd, in Northwest Austin and is one block from HWY. 183 and McNeil
• Rental rate: $10.50 to $11.50 per square foot annually NNN. Current NNN is $8.00 per square foot.
Listing Agents

Robert Hemphill
O: 512-474-2224
robertrhemphill@austin.rr.com
O: 512-474-2224
robertrhemphill@austin.rr.com
While we strive to provide the most accurate information, all listing information, and demographic data, is provided by third-parties. As such, MyEListing will not be responsible for the accuracy of the information. It is strongly recommended that you verify all information with the listing agent, and any relevant agencies, prior to making any decisions.