Commercial Land
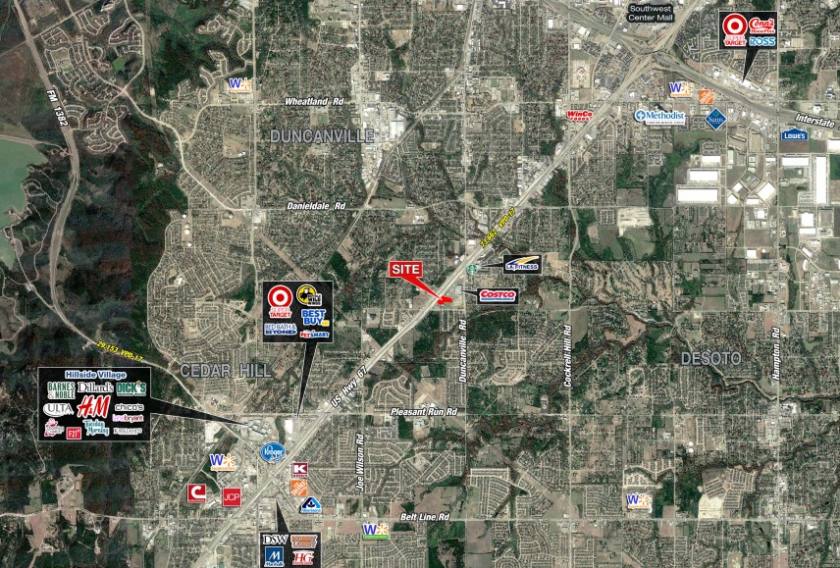
US 67 and Wintergreen Rd Duncanville, TX 75137
US 67 and Wintergreen Rd Duncanville, TX 75137
Details & Description
Property Highlights
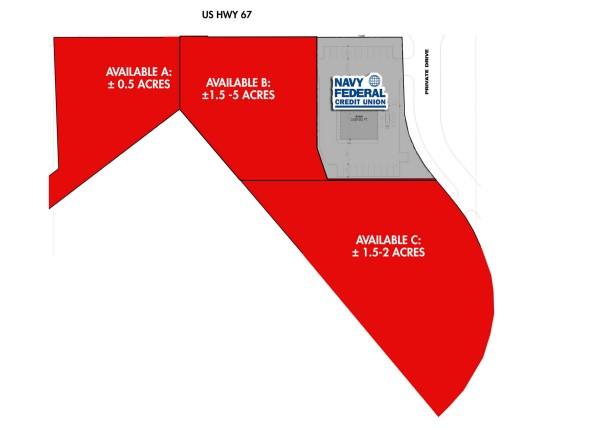
- • 4.08 Acres Available for Ground Lease or Purchase
- • Can Divide
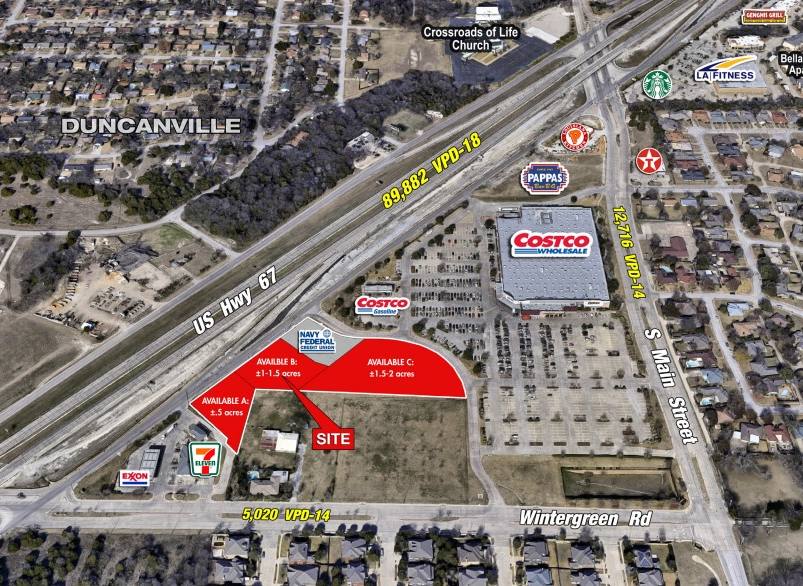
- • Traffic Counts: US Hwy 67: 86,562 VPD-17
- • Traffic Counts: S. Main Street: 12,716 VPD-14
- • Traffic Counts: Wintergreen Rd.: 5,020 VPD-14
Listing Agents

Daniel Frid
O: 214-960-4545
M: 214-501-5108
dfrid@shopcompanies.com
O: 214-960-4545
M: 214-501-5108
dfrid@shopcompanies.com

Jake Sherrington
O: 214-960-4545
M: 214-960-4623
jake@shopcompanies.com
O: 214-960-4545
M: 214-960-4623
jake@shopcompanies.com
While we strive to provide the most accurate information, all listing information, and demographic data, is provided by third-parties. As such, MyEListing will not be responsible for the accuracy of the information. It is strongly recommended that you verify all information with the listing agent, and any relevant agencies, prior to making any decisions.