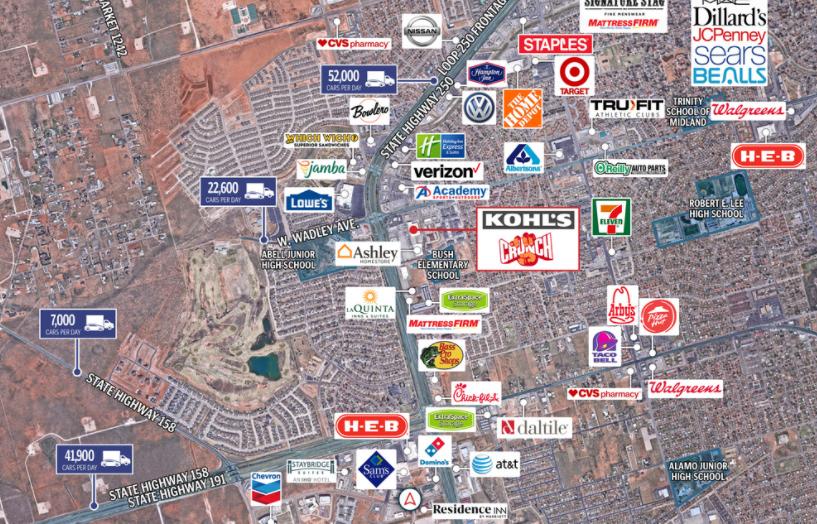
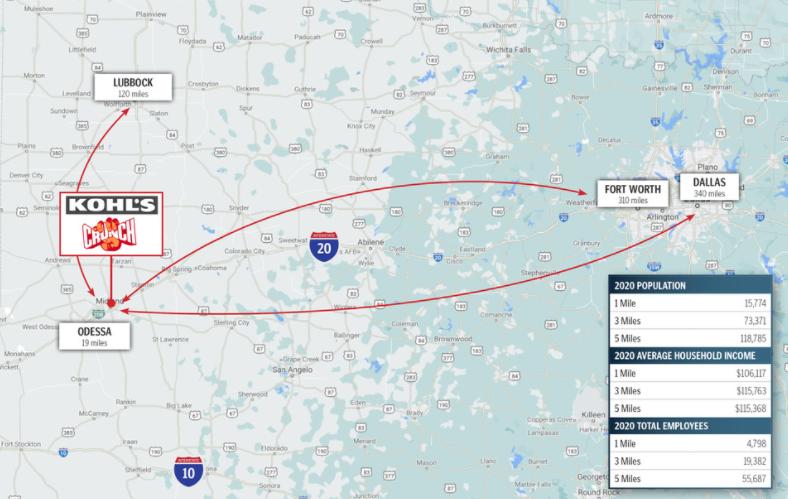
1-Mile | 3-Miles | 5-Miles | ||
---|---|---|---|---|
Total Population | 12,599 | 70,902 | 111,951 | |
Population Median Age | 35 | 34 | 34 | |
Population by Age | 0-9 Yrs | 2058 (16%) | 10880 (15%) | 17839 (15%) |
10-19 Yrs | 1337 (10%) | 9281 (13%) | 15032 (13%) | |
20-29 Yrs | 2366 (18%) | 12387 (17%) | 18796 (16%) | |
30-39 Yrs | 2077 (16%) | 11453 (16%) | 17486 (15%) | |
40-49 Yrs | 1620 (12%) | 8462 (11%) | 13011 (11%) | |
50-59 Yrs | 1223 (9%) | 7418 (10%) | 12156 (10%) | |
60-69 Yrs | 821 (6%) | 5928 (8%) | 9378 (8%) | |
70+ Yrs | 1097 (8%) | 5094 (7%) | 8253 (7%) | |
Median HH Income | $71,414 | $86,938 | $83,721 | |
Total Household Income | < 24K | 744 (15%) | 2774 (11%) | 4782 (12%) |
25-49K | 827 (17%) | 3792 (15%) | 6154 (15%) | |
50-74K | 998 (20%) | 4358 (17%) | 6671 (17%) | |
75-99K | 545 (11%) | 3528 (13%) | 5381 (13%) | |
100-199K | 1255 (25%) | 7508 (29%) | 10904 (27%) | |
200K+ | 474 (9%) | 3258 (12%) | 5077 (13%) | |
Highest Education Level | No Diploma | 549 | 4288 | 8446 |
Diploma or GED | 1784 | 11076 | 17136 | |
Some College | 1867 | 10761 | 16672 | |
Assoc. Degree | 696 | 4052 | 5775 | |
Bachelors Degree | 2176 | 10353 | 16325 | |
Higher Degree | 886 | 4201 | 6402 | |
Total Housing Units | 5,012 | 26,824 | 41,640 | |
--Owner-Occupied | 2,333 | 15,724 | 25,285 | |
--Renter-Occupied | 2,508 | 9,494 | 13,684 | |
Owner-Occupied Values | < 100K | 48 | 891 | 2771 |
100-199K | 477 | 4671 | 7487 | |
200-299K | 1084 | 5292 | 7573 | |
300-399K | 283 | 2290 | 3492 | |
400-499K | 184 | 1211 | 1583 | |
500K+ | 257 | 1370 | 2380 | |
Total Working Age Population | 9,541 | 53,717 | 84,041 | |
In Work Force | 6,874 | 39,085 | 60,225 | |
Not In Work Force | 2,668 | 14,632 | 23,817 | |
Workforce Employed | 6,700 | 37,965 | 58,307 | |
Workforce Unemployed | 174 | 1,104 | 1,878 | |
Civlian Workforce | 6,874 | 39,069 | 60,184 | |
Military Workforce | 0 | 16 | 40 | |
Total Households | 4,842 | 25,218 | 38,969 | |
Family Households | 2,816 | 17,135 | 26,572 | |
Non-Family Households | 2,025 | 8,083 | 12,397 | |
Married Couple | 2,181 | 13,252 | 20,184 | |
Other Family | 635 | 3,883 | 6,387 | |
Married w/Child | 1,095 | 5,930 | 9,108 | |
Single Male w/Child | 187 | 653 | 1,107 | |
Single Female w/Child | 318 | 1,666 | 2,601 |
Population Change Last Two Decades - Plus Projection
2000 | % | 2010 | % | 2020 | % | 2030 | |
---|---|---|---|---|---|---|---|
Texas | 20,851,820 | +21 | 25,145,561 | +18 | 29,677,668 | +18 | 34,894,452 |
Midland County | 116,009 | +18 | 136,872 | +37 | 187,364 | +43 | 268,123 |
Total Working Age Population:
Total Households:
Total Working Age Population:
Total Households:
Total Working Age Population:
Total Households: