$1.20 per sq ft per month
500 sq ft minimum per month
4,000 total sq ft available for rent
- THIS WAREHOUSE ALLOWS LABOR AND STORAGE INSIDE
- YOU CAN WORK IN THE WAREHOUSE REGULARLY
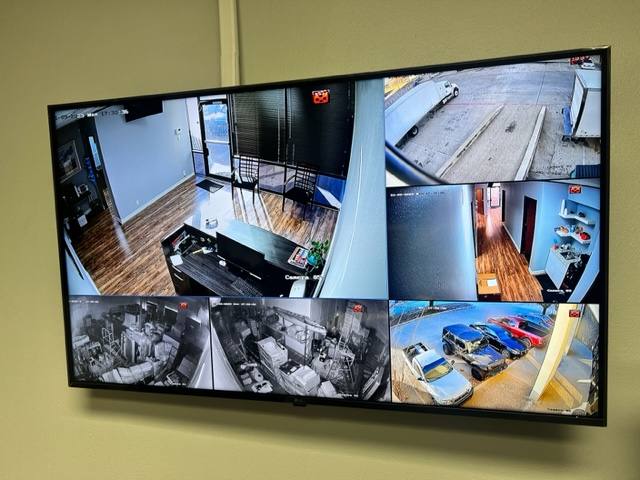
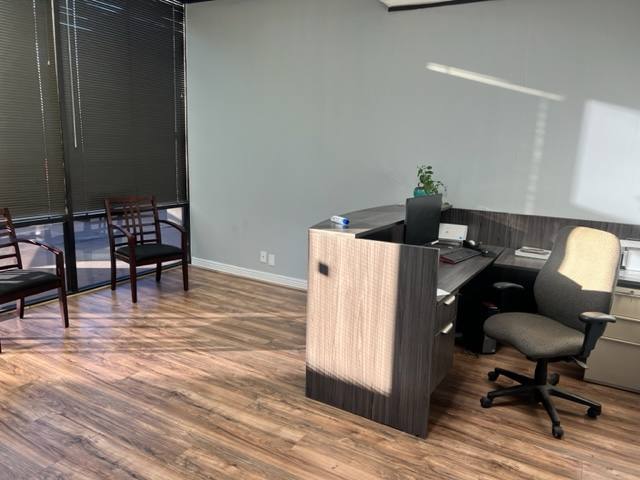
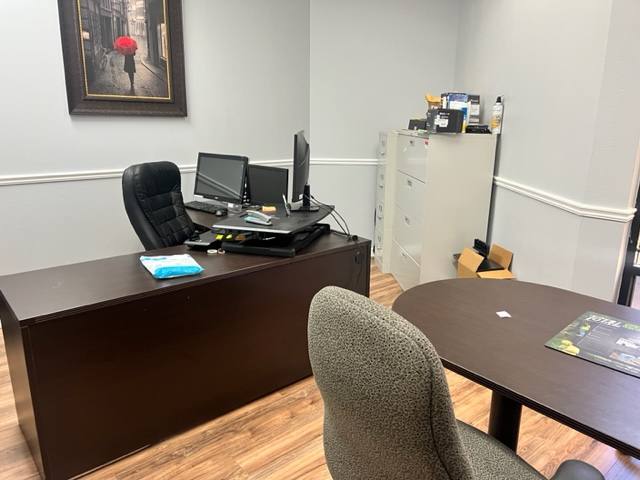
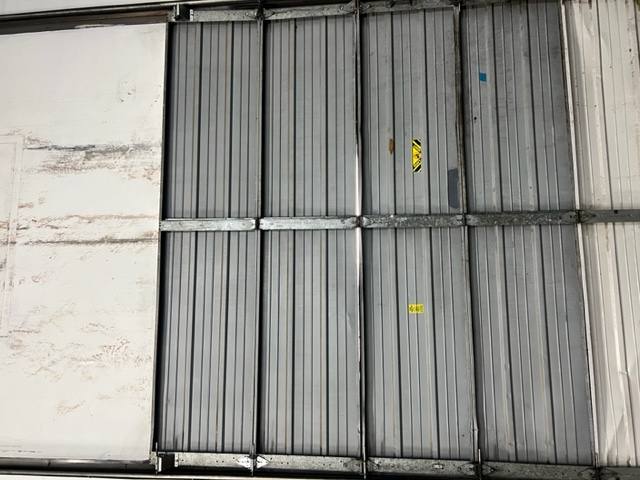
This is a state of art facility with front office access and back warehouse access. Facility has security cameras and is secured with a 24/7 alarm system. Very secure area and a few minutes to the DFW Airport.
Book a tour or view full warehouse details here: https://www.warehouseexchange.com/warehouse/1082
If you are interested in this facility please fill out the form below, it is sent directly to me. I will have the tenant manager respond back to you to book a tour to see the space and discuss pricing: https://share.hsforms.com/1ZK3ynKGAQb6AkLKipzmcUQbvwy5
If you would like to talk about the property give us a call at (424) 239-2738
No part of this information may be copied, reproduced, repurposed, or screen-captured for any commercial purpose without prior written authorization from MyEListing.
While we strive to provide the most accurate information, all listing information, and demographic data, is provided by third-parties. As such, MyEListing will not be responsible for the accuracy of the information. It is strongly recommended that you verify all information with the listing agent, and any relevant agencies, prior to making any decisions.
What is the asking price for 2202 113th Street in Grand Prairie?
The asking price for 2202 113th Street is $14.40 a SF per Year
What is the building size of this commercial Industrial property?
The size of this multi-unit property varies between 500 - 4000 square feet
What kind of Industrial is the propery at 2202 113th Street?
The property at 2202 113th Street Grand Prairie, TX 75050 is listed as a Warehouse Industrial property
What is the population within 1 mile of 2202 113th Street in Grand Prairie?
The population within 1 mile of 2202 113th Street Grand Prairie, TX 75050 is 2,492 people.
Who do I contact for questions about 2202 113th Street?
You should contact the listing agent,
Warehouse Exchange, for any details regarding this commercial listing.