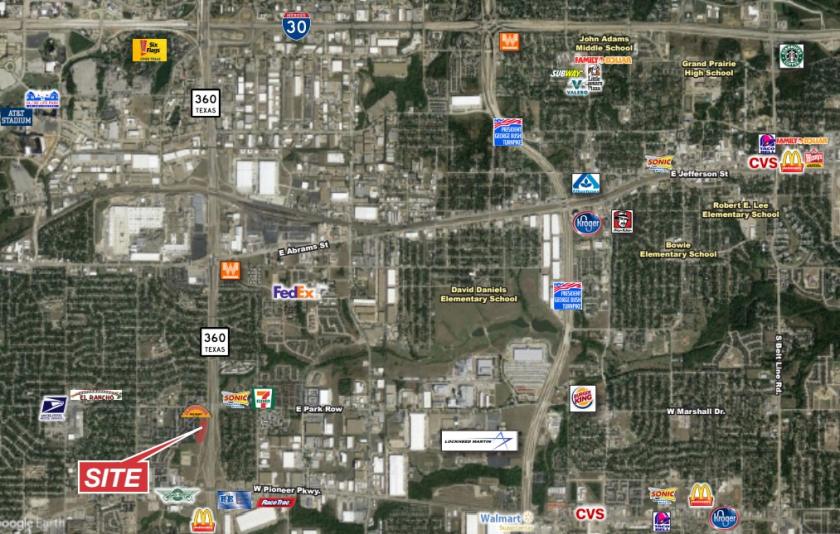
1-Mile | 3-Miles | 5-Miles | ||
---|---|---|---|---|
Total Population | 23,606 | 121,315 | 336,067 | |
Population Median Age | 30 | 32 | 34 | |
Population by Age | 0-9 Yrs | 4609 (19%) | 20759 (17%) | 50051 (14%) |
10-19 Yrs | 4225 (17%) | 20097 (16%) | 51185 (15%) | |
20-29 Yrs | 3857 (16%) | 21415 (17%) | 60421 (17%) | |
30-39 Yrs | 3622 (15%) | 17521 (14%) | 46767 (13%) | |
40-49 Yrs | 2987 (12%) | 15204 (12%) | 42169 (12%) | |
50-59 Yrs | 2140 (9%) | 11577 (9%) | 37238 (11%) | |
60-69 Yrs | 1195 (5%) | 8718 (7%) | 27652 (8%) | |
70+ Yrs | 971 (4%) | 6024 (4%) | 20585 (6%) | |
Median HH Income | $40,878 | $44,628 | $54,097 | |
Total Household Income | < 24K | 2174 (28%) | 10156 (25%) | 22390 (19%) |
25-49K | 2450 (32%) | 11451 (29%) | 30972 (26%) | |
50-74K | 1531 (20%) | 7966 (20%) | 24396 (21%) | |
75-99K | 724 (9%) | 4848 (12%) | 15246 (13%) | |
100-199K | 660 (8%) | 4356 (11%) | 19669 (17%) | |
200K+ | 46 (0%) | 324 (0%) | 2922 (2%) | |
Highest Education Level | No Diploma | 4572 | 21368 | 44441 |
Diploma or GED | 3770 | 20874 | 56914 | |
Some College | 2112 | 13130 | 45624 | |
Assoc. Degree | 689 | 4226 | 14663 | |
Bachelors Degree | 1203 | 7545 | 30786 | |
Higher Degree | 284 | 2546 | 13996 | |
Total Housing Units | 8,755 | 42,806 | 126,816 | |
--Owner-Occupied | 2,213 | 15,581 | 51,681 | |
--Renter-Occupied | 5,371 | 23,522 | 63,915 | |
Owner-Occupied Values | < 100K | 729 | 4101 | 10315 |
100-199K | 1236 | 9192 | 26598 | |
200-299K | 219 | 1996 | 11248 | |
300-399K | 0 | 224 | 2334 | |
400-499K | 17 | 18 | 630 | |
500K+ | 12 | 51 | 555 | |
Total Working Age Population | 16,189 | 88,934 | 255,542 | |
In Work Force | 11,321 | 60,061 | 176,851 | |
Not In Work Force | 4,868 | 28,873 | 78,690 | |
Workforce Employed | 10,695 | 56,693 | 166,785 | |
Workforce Unemployed | 617 | 3,345 | 9,977 | |
Civlian Workforce | 11,312 | 60,038 | 176,762 | |
Military Workforce | 9 | 23 | 89 | |
Total Households | 7,584 | 39,103 | 115,596 | |
Family Households | 4,996 | 26,146 | 75,608 | |
Non-Family Households | 2,588 | 12,957 | 39,988 | |
Married Couple | 3,088 | 16,368 | 49,248 | |
Other Family | 1,908 | 9,778 | 26,360 | |
Married w/Child | 1,747 | 8,147 | 22,001 | |
Single Male w/Child | 245 | 1,390 | 3,352 | |
Single Female w/Child | 1,021 | 4,306 | 11,424 |
Population Change Last Two Decades - Plus Projection
2000 | % | 2010 | % | 2020 | % | 2030 | |
---|---|---|---|---|---|---|---|
Texas | 20,851,820 | +21 | 25,145,561 | +18 | 29,677,668 | +18 | 34,894,452 |
Tarrant County | 1,446,219 | +25 | 1,809,034 | +19 | 2,143,755 | +17 | 2,507,170 |
Dallas County | 2,218,899 | +7 | 2,368,139 | +15 | 2,734,111 | +14 | 3,106,298 |
Total Working Age Population:
Total Households:
Total Working Age Population:
Total Households:
Total Working Age Population:
Total Households: