Commercial Land
2370 I-20 Frontage Rd Grand Prairie, TX 75052
2370 I-20 Frontage Rd Grand Prairie, TX 75052
Details & Description
Property Highlights
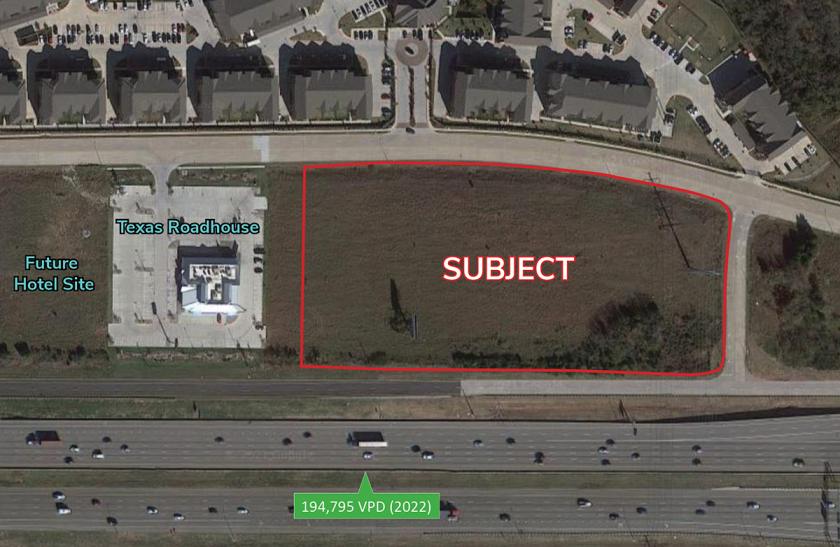
- • Size: 6.445± acres
- • Utilities: All available in street
- • Zoning: PD Commercial
Listing Agents

Eric Davis
O: 512-682-1000
M: 817-565-5710
eric@cipaustin.com
O: 512-682-1000
M: 817-565-5710
eric@cipaustin.com
While we strive to provide the most accurate information, all listing information, and demographic data, is provided by third-parties. As such, MyEListing will not be responsible for the accuracy of the information. It is strongly recommended that you verify all information with the listing agent, and any relevant agencies, prior to making any decisions.