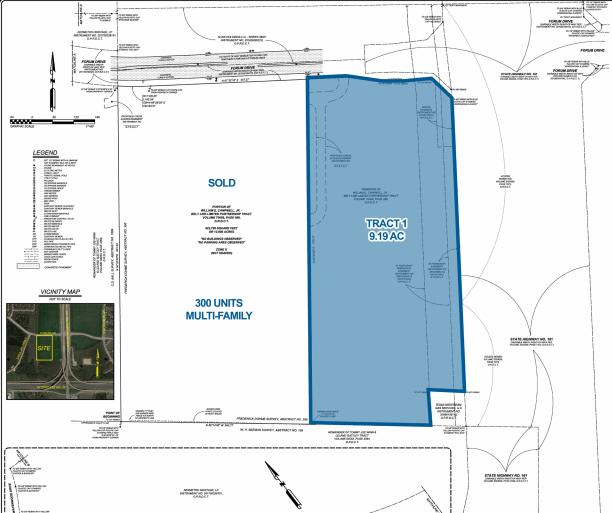
1-Mile | 3-Miles | 5-Miles | ||
---|---|---|---|---|
Total Population | 13,488 | 107,468 | 275,010 | |
Population Median Age | 35 | 34 | 33 | |
Population by Age | 0-9 Yrs | 1585 (11%) | 15342 (14%) | 43579 (15%) |
10-19 Yrs | 2389 (17%) | 17922 (16%) | 45252 (16%) | |
20-29 Yrs | 2009 (14%) | 15827 (14%) | 42670 (15%) | |
30-39 Yrs | 1505 (11%) | 14627 (13%) | 38341 (13%) | |
40-49 Yrs | 2411 (17%) | 15314 (14%) | 37877 (13%) | |
50-59 Yrs | 1555 (11%) | 13209 (12%) | 32023 (11%) | |
60-69 Yrs | 1462 (10%) | 9549 (8%) | 21465 (7%) | |
70+ Yrs | 573 (4%) | 5679 (5%) | 13803 (5%) | |
Median HH Income | $76,272 | $68,972 | $59,404 | |
Total Household Income | < 24K | 336 (8%) | 4120 (12%) | 13669 (16%) |
25-49K | 749 (18%) | 7337 (21%) | 21241 (25%) | |
50-74K | 909 (22%) | 7179 (21%) | 17982 (21%) | |
75-99K | 679 (16%) | 5397 (15%) | 12413 (14%) | |
100-199K | 1295 (31%) | 8776 (25%) | 16460 (19%) | |
200K+ | 89 (2%) | 1121 (3%) | 2226 (2%) | |
Highest Education Level | No Diploma | 1171 | 11141 | 37898 |
Diploma or GED | 2685 | 18485 | 47081 | |
Some College | 2083 | 15626 | 34661 | |
Assoc. Degree | 627 | 5657 | 11606 | |
Bachelors Degree | 1489 | 11296 | 23517 | |
Higher Degree | 411 | 4358 | 9435 | |
Total Housing Units | 4,358 | 36,247 | 89,997 | |
--Owner-Occupied | 3,086 | 22,193 | 49,881 | |
--Renter-Occupied | 971 | 11,737 | 34,110 | |
Owner-Occupied Values | < 100K | 179 | 3325 | 10914 |
100-199K | 2123 | 12491 | 27032 | |
200-299K | 684 | 4857 | 9557 | |
300-399K | 38 | 1237 | 1765 | |
400-499K | 20 | 83 | 192 | |
500K+ | 43 | 200 | 421 | |
Total Working Age Population | 10,451 | 80,965 | 204,293 | |
In Work Force | 7,641 | 57,687 | 141,336 | |
Not In Work Force | 2,810 | 23,277 | 62,957 | |
Workforce Employed | 7,177 | 54,866 | 134,217 | |
Workforce Unemployed | 464 | 2,812 | 7,068 | |
Civlian Workforce | 7,641 | 57,678 | 141,285 | |
Military Workforce | 0 | 9 | 50 | |
Total Households | 4,057 | 33,930 | 83,991 | |
Family Households | 3,334 | 25,933 | 63,640 | |
Non-Family Households | 723 | 7,997 | 20,351 | |
Married Couple | 2,373 | 18,187 | 42,459 | |
Other Family | 961 | 7,745 | 21,182 | |
Married w/Child | 1,032 | 8,354 | 20,617 | |
Single Male w/Child | 81 | 1,100 | 2,714 | |
Single Female w/Child | 376 | 2,903 | 8,599 |
Population Change Last Two Decades - Plus Projection
2000 | % | 2010 | % | 2020 | % | 2030 | |
---|---|---|---|---|---|---|---|
Texas | 20,851,820 | +21 | 25,145,561 | +18 | 29,677,668 | +18 | 34,894,452 |
Dallas County | 2,218,899 | +7 | 2,368,139 | +15 | 2,734,111 | +14 | 3,106,298 |
Tarrant County | 1,446,219 | +25 | 1,809,034 | +19 | 2,143,755 | +17 | 2,507,170 |
Total Working Age Population:
Total Households:
Total Working Age Population:
Total Households:
Total Working Age Population:
Total Households: