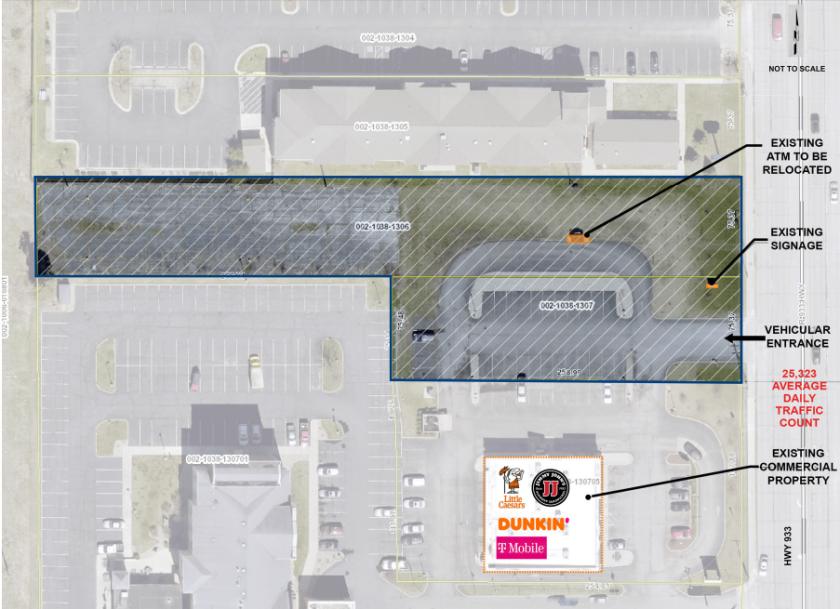
Commercial Land
52885 State Highway 933 South Bend, IN 46637
52885 State Highway 933 South Bend, IN 46637
Details & Description
Property Highlights
- • Rate $28.00 - $32.00 $/SF/Year
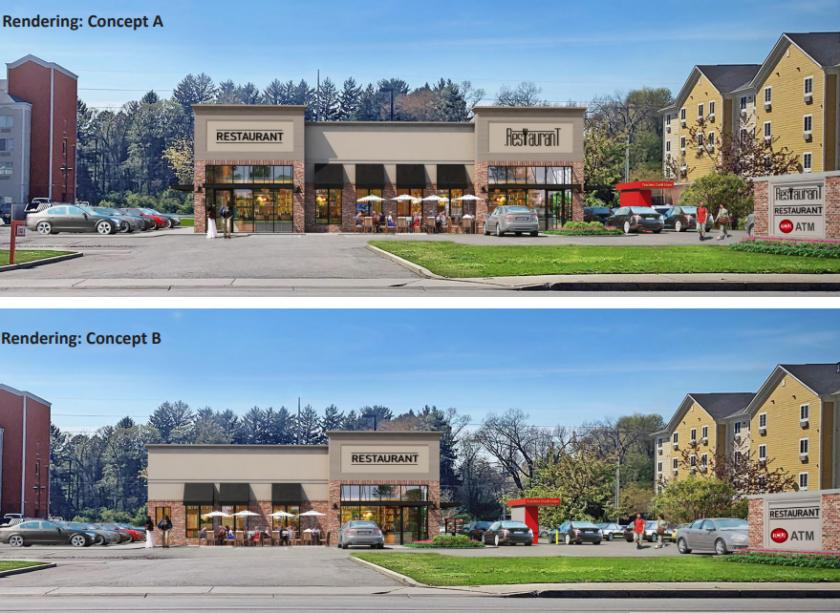
- • Build to Suit
- • Strong Traffic
- • Minutes north of the University of Notre Dame
- • Drive Through Available
- • Minutes from I80/90 Interchange (Exit 77)
Listing Agents

John Mester
O: 574-485-1501
M: 574-274-7675
jmester@cressy.com
O: 574-485-1501
M: 574-274-7675
jmester@cressy.com

Sheral Litell
O: 574-271-4060
M: 574-485-1527
slitell@cressy.com
O: 574-271-4060
M: 574-485-1527
slitell@cressy.com
While we strive to provide the most accurate information, all listing information, and demographic data, is provided by third-parties. As such, MyEListing will not be responsible for the accuracy of the information. It is strongly recommended that you verify all information with the listing agent, and any relevant agencies, prior to making any decisions.