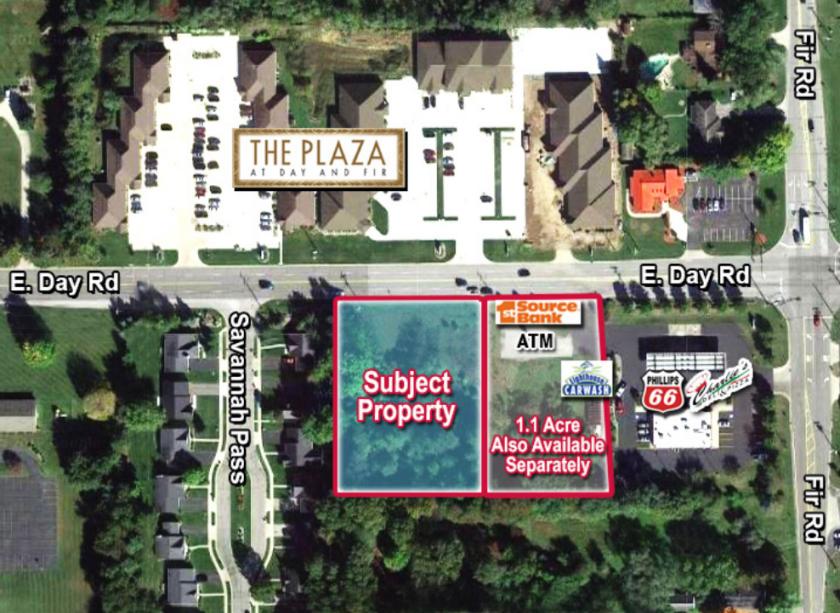
1-Mile | 3-Miles | 5-Miles | ||
---|---|---|---|---|
Total Population | 3,195 | 47,371 | 143,892 | |
Population Median Age | 38 | 39 | 37 | |
Population by Age | 0-9 Yrs | 470 (14%) | 6022 (12%) | 17167 (11%) |
10-19 Yrs | 365 (11%) | 5448 (11%) | 21704 (15%) | |
20-29 Yrs | 570 (17%) | 7992 (16%) | 23884 (16%) | |
30-39 Yrs | 382 (11%) | 6012 (12%) | 17904 (12%) | |
40-49 Yrs | 322 (10%) | 5814 (12%) | 16448 (11%) | |
50-59 Yrs | 282 (8%) | 5093 (10%) | 16065 (11%) | |
60-69 Yrs | 519 (16%) | 5903 (12%) | 16805 (11%) | |
70+ Yrs | 284 (8%) | 5087 (10%) | 13915 (9%) | |
Median HH Income | $48,625 | $46,748 | $56,995 | |
Total Household Income | < 24K | 353 (25%) | 5179 (25%) | 11390 (20%) |
25-49K | 355 (25%) | 5870 (28%) | 13220 (23%) | |
50-74K | 229 (16%) | 3981 (19%) | 10701 (19%) | |
75-99K | 177 (12%) | 2336 (11%) | 6898 (12%) | |
100-199K | 204 (14%) | 2608 (12%) | 10372 (18%) | |
200K+ | 63 (4%) | 667 (3%) | 3017 (5%) | |
Highest Education Level | No Diploma | 257 | 3501 | 7681 |
Diploma or GED | 536 | 9316 | 24612 | |
Some College | 401 | 6684 | 18543 | |
Assoc. Degree | 165 | 2439 | 7386 | |
Bachelors Degree | 543 | 6399 | 19016 | |
Higher Degree | 315 | 3953 | 14315 | |
Total Housing Units | 1,478 | 23,563 | 62,435 | |
--Owner-Occupied | 661 | 10,949 | 35,745 | |
--Renter-Occupied | 721 | 9,692 | 19,852 | |
Owner-Occupied Values | < 100K | 114 | 3915 | 10700 |
100-199K | 247 | 4433 | 14477 | |
200-299K | 194 | 1648 | 6382 | |
300-399K | 56 | 451 | 1996 | |
400-499K | 1 | 104 | 679 | |
500K+ | 49 | 397 | 1511 | |
Total Working Age Population | 2,535 | 38,173 | 115,614 | |
In Work Force | 1,592 | 25,164 | 74,243 | |
Not In Work Force | 943 | 13,009 | 41,371 | |
Workforce Employed | 1,533 | 23,564 | 70,335 | |
Workforce Unemployed | 40 | 1,543 | 3,790 | |
Civlian Workforce | 1,573 | 25,107 | 74,124 | |
Military Workforce | 20 | 57 | 119 | |
Total Households | 1,382 | 20,641 | 55,596 | |
Family Households | 842 | 10,979 | 32,923 | |
Non-Family Households | 539 | 9,662 | 22,673 | |
Married Couple | 590 | 7,521 | 24,334 | |
Other Family | 252 | 3,457 | 8,589 | |
Married w/Child | 196 | 2,748 | 9,684 | |
Single Male w/Child | 6 | 497 | 1,226 | |
Single Female w/Child | 111 | 1,352 | 3,619 |
Population Change Last Two Decades - Plus Projection
2000 | % | 2010 | % | 2020 | % | 2030 | |
---|---|---|---|---|---|---|---|
Indiana | 6,080,485 | +7 | 6,483,802 | +4 | 6,738,573 | +4 | 7,014,880 |
St. Joseph County | 265,559 | +1 | 266,931 | +1 | 269,113 | +1 | 271,912 |
Michigan | 9,938,444 | -1 | 9,883,640 | +1 | 10,023,423 | +4 | 10,424,510 |
Cass County | 51,104 | +2 | 52,293 | -2 | 51,383 | +3 | 53,143 |
Total Working Age Population:
Total Households:
Total Working Age Population:
Total Households:
Total Working Age Population:
Total Households: