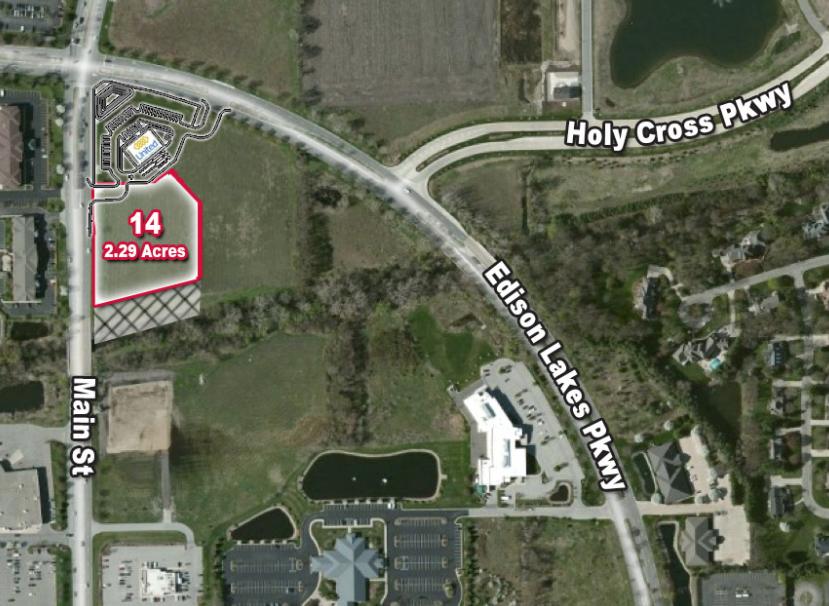
1-Mile | 3-Miles | 5-Miles | ||
---|---|---|---|---|
Total Population | 7,685 | 63,195 | 156,888 | |
Population Median Age | 38 | 38 | 37 | |
Population by Age | 0-9 Yrs | 728 (9%) | 6720 (10%) | 18975 (12%) |
10-19 Yrs | 755 (9%) | 9012 (14%) | 23439 (14%) | |
20-29 Yrs | 1805 (23%) | 12600 (19%) | 26931 (17%) | |
30-39 Yrs | 1305 (16%) | 7864 (12%) | 19449 (12%) | |
40-49 Yrs | 790 (10%) | 6845 (10%) | 17521 (11%) | |
50-59 Yrs | 761 (9%) | 6036 (9%) | 17251 (10%) | |
60-69 Yrs | 661 (8%) | 7719 (12%) | 18442 (11%) | |
70+ Yrs | 879 (11%) | 6400 (10%) | 14880 (9%) | |
Median HH Income | $38,186 | $48,251 | $53,352 | |
Total Household Income | < 24K | 1275 (30%) | 6133 (23%) | 13659 (22%) |
25-49K | 1564 (37%) | 7499 (28%) | 15038 (24%) | |
50-74K | 701 (16%) | 5134 (19%) | 11535 (18%) | |
75-99K | 302 (7%) | 2888 (10%) | 7234 (11%) | |
100-199K | 264 (6%) | 3678 (13%) | 10296 (16%) | |
200K+ | 88 (2%) | 998 (3%) | 3067 (5%) | |
Highest Education Level | No Diploma | 383 | 3724 | 9343 |
Diploma or GED | 1633 | 10096 | 26541 | |
Some College | 1075 | 8221 | 20414 | |
Assoc. Degree | 425 | 2933 | 8156 | |
Bachelors Degree | 1032 | 8768 | 19426 | |
Higher Degree | 892 | 6503 | 15555 | |
Total Housing Units | 4,861 | 30,373 | 69,297 | |
--Owner-Occupied | 870 | 13,800 | 38,044 | |
--Renter-Occupied | 3,324 | 12,529 | 22,785 | |
Owner-Occupied Values | < 100K | 273 | 4637 | 13281 |
100-199K | 355 | 5709 | 14536 | |
200-299K | 158 | 1904 | 5796 | |
300-399K | 56 | 780 | 2115 | |
400-499K | 0 | 160 | 712 | |
500K+ | 29 | 609 | 1605 | |
Total Working Age Population | 6,469 | 52,239 | 125,849 | |
In Work Force | 4,611 | 33,149 | 79,905 | |
Not In Work Force | 1,858 | 19,090 | 45,945 | |
Workforce Employed | 4,275 | 31,234 | 75,642 | |
Workforce Unemployed | 322 | 1,840 | 4,111 | |
Civlian Workforce | 4,597 | 33,075 | 79,753 | |
Military Workforce | 14 | 75 | 152 | |
Total Households | 4,194 | 26,329 | 60,829 | |
Family Households | 1,401 | 13,529 | 34,860 | |
Non-Family Households | 2,792 | 12,799 | 25,969 | |
Married Couple | 948 | 9,562 | 24,799 | |
Other Family | 453 | 3,967 | 10,061 | |
Married w/Child | 362 | 3,488 | 9,529 | |
Single Male w/Child | 111 | 595 | 1,416 | |
Single Female w/Child | 135 | 1,599 | 4,404 |
Population Change Last Two Decades - Plus Projection
2000 | % | 2010 | % | 2020 | % | 2030 | |
---|---|---|---|---|---|---|---|
Indiana | 6,080,485 | +7 | 6,483,802 | +4 | 6,738,573 | +4 | 7,014,880 |
St. Joseph County | 265,559 | +1 | 266,931 | +1 | 269,113 | +1 | 271,912 |
Michigan | 9,938,444 | -1 | 9,883,640 | +1 | 10,023,423 | +4 | 10,424,510 |
Berrien County | 162,453 | -3 | 156,813 | -2 | 153,154 | +2 | 156,590 |
Cass County | 51,104 | +2 | 52,293 | -2 | 51,383 | +3 | 53,143 |
Total Working Age Population:
Total Households:
Total Working Age Population:
Total Households:
Total Working Age Population:
Total Households: