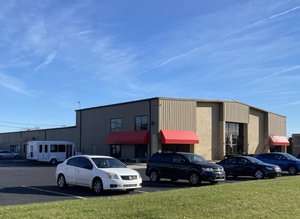
1-Mile | 3-Miles | 5-Miles | ||
---|---|---|---|---|
Total Population | 9,212 | 65,743 | 147,754 | |
Population Median Age | 36 | 36 | 36 | |
Population by Age | 0-9 Yrs | 1472 (15%) | 9157 (13%) | 19225 (13%) |
10-19 Yrs | 1215 (13%) | 10097 (15%) | 23337 (15%) | |
20-29 Yrs | 1189 (12%) | 9218 (14%) | 26003 (17%) | |
30-39 Yrs | 1304 (14%) | 9322 (14%) | 18820 (12%) | |
40-49 Yrs | 1321 (14%) | 7835 (11%) | 16038 (10%) | |
50-59 Yrs | 1143 (12%) | 7142 (10%) | 15292 (10%) | |
60-69 Yrs | 911 (9%) | 7437 (11%) | 16006 (10%) | |
70+ Yrs | 657 (7%) | 5534 (8%) | 13033 (8%) | |
Median HH Income | $43,723 | $44,344 | $43,266 | |
Total Household Income | < 24K | 1009 (26%) | 6936 (27%) | 16080 (28%) |
25-49K | 1124 (29%) | 6853 (27%) | 15752 (28%) | |
50-74K | 699 (18%) | 4955 (19%) | 10960 (19%) | |
75-99K | 450 (11%) | 2503 (9%) | 5386 (9%) | |
100-199K | 451 (12%) | 3134 (12%) | 6406 (11%) | |
200K+ | 22 (0%) | 697 (2%) | 1308 (2%) | |
Highest Education Level | No Diploma | 808 | 5360 | 12219 |
Diploma or GED | 1951 | 12615 | 28548 | |
Some College | 1286 | 9046 | 18879 | |
Assoc. Degree | 609 | 3829 | 7332 | |
Bachelors Degree | 928 | 6317 | 13776 | |
Higher Degree | 352 | 4896 | 10189 | |
Total Housing Units | 4,367 | 28,859 | 65,155 | |
--Owner-Occupied | 2,343 | 14,837 | 32,167 | |
--Renter-Occupied | 1,412 | 10,240 | 23,725 | |
Owner-Occupied Values | < 100K | 1706 | 8272 | 17659 |
100-199K | 570 | 4757 | 10474 | |
200-299K | 19 | 884 | 2091 | |
300-399K | 33 | 540 | 993 | |
400-499K | 9 | 138 | 265 | |
500K+ | 5 | 246 | 684 | |
Total Working Age Population | 6,907 | 50,300 | 116,111 | |
In Work Force | 4,284 | 31,862 | 72,361 | |
Not In Work Force | 2,623 | 18,439 | 43,751 | |
Workforce Employed | 4,071 | 29,806 | 67,691 | |
Workforce Unemployed | 213 | 2,047 | 4,590 | |
Civlian Workforce | 4,284 | 31,853 | 72,281 | |
Military Workforce | 0 | 9 | 80 | |
Total Households | 3,755 | 25,077 | 55,892 | |
Family Households | 1,943 | 13,929 | 30,634 | |
Non-Family Households | 1,812 | 11,148 | 25,258 | |
Married Couple | 948 | 8,495 | 19,008 | |
Other Family | 995 | 5,434 | 11,627 | |
Married w/Child | 337 | 3,454 | 7,493 | |
Single Male w/Child | 176 | 611 | 1,297 | |
Single Female w/Child | 412 | 2,616 | 5,423 |
Population Change Last Two Decades - Plus Projection
2000 | % | 2010 | % | 2020 | % | 2030 | |
---|---|---|---|---|---|---|---|
Indiana | 6,080,485 | +7 | 6,483,802 | +4 | 6,738,573 | +4 | 7,014,880 |
St. Joseph County | 265,559 | +1 | 266,931 | +1 | 269,113 | +1 | 271,912 |
Total Working Age Population:
Total Households:
Total Working Age Population:
Total Households:
Total Working Age Population:
Total Households: