Industrial Properties
332 U.S. 20 Michigan City, IN 46360
332 U.S. 20 Michigan City, IN 46360

Details & Description
Property Highlights
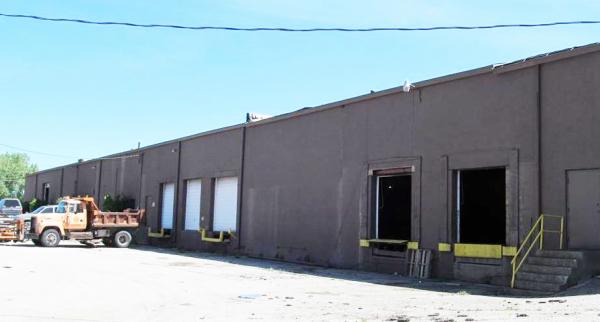
- • Large amount of docks service the building.
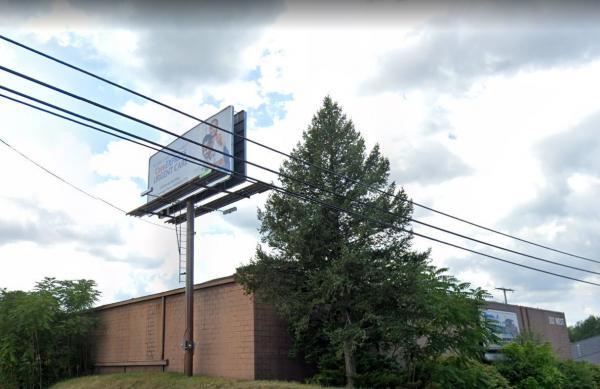
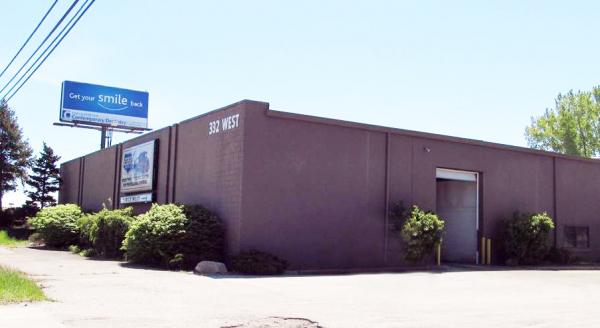
- • Value-added annual billboard income.
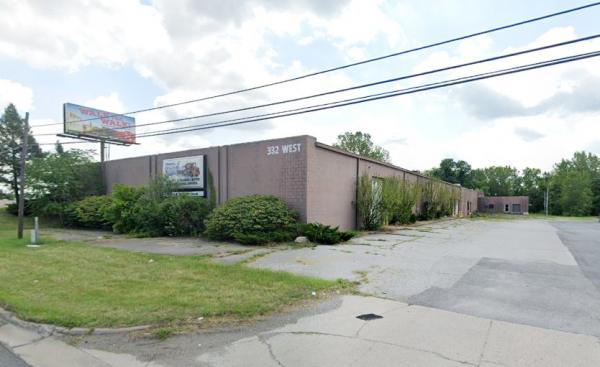
- • Building signage.
- • Municipal water and sewer.
- • Ample on-site surface parking.
Additional Photos

Listing Agents

Lina Dalloul
lbdalloul@cressy.com
lbdalloul@cressy.com
While we strive to provide the most accurate information, all listing information, and demographic data, is provided by third-parties. As such, MyEListing will not be responsible for the accuracy of the information. It is strongly recommended that you verify all information with the listing agent, and any relevant agencies, prior to making any decisions.