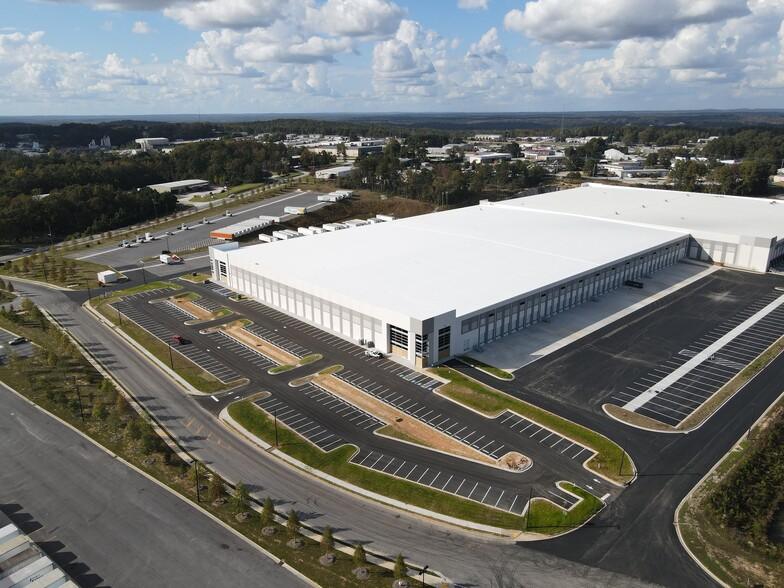
Flex-Office-Warehouse
7600 Wood Road Douglasville, GA 30134
7600 Wood Road Douglasville, GA 30134

Details & Description
Property Highlights
- • 24/7 Building Access
- • Dedicated or Shared Loading Docks
- • CCTV Security and Cameras
- • 36' Clear Height, 4 x Drive-In Bays
- • Customized Warehouse Units
- • On-Site Manager
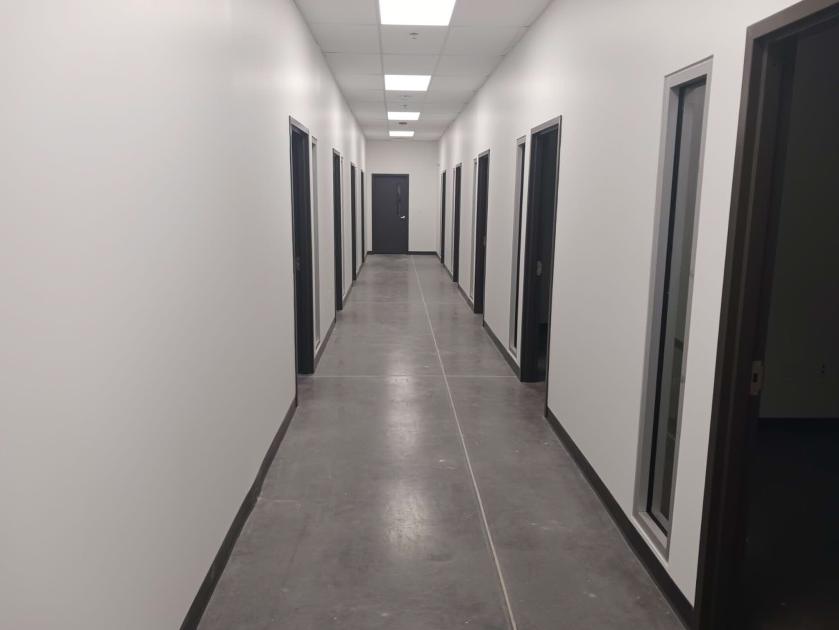
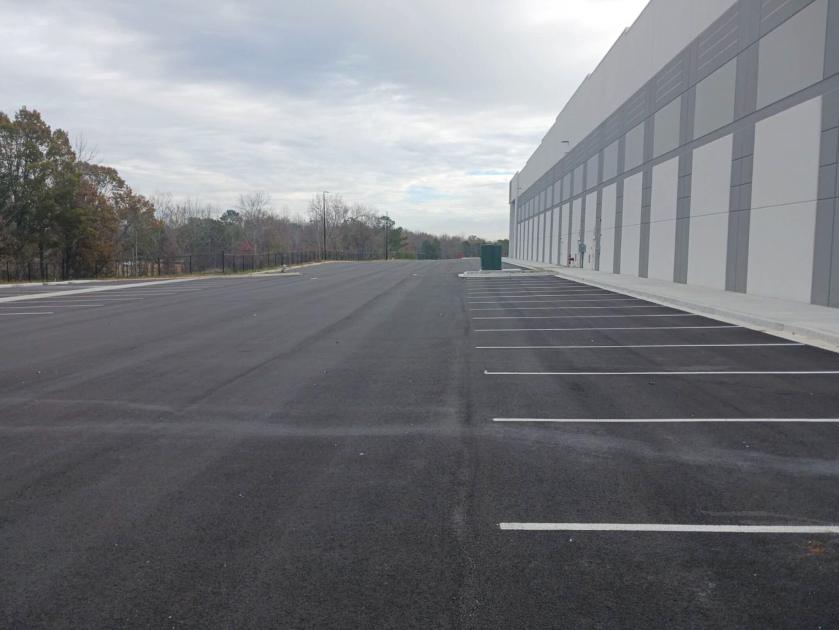
Additional Photos

Listing Agents

Joe Lee
O: 800-338-6369
joe.lee@cubework.com
O: 800-338-6369
joe.lee@cubework.com
While we strive to provide the most accurate information, all listing information, and demographic data, is provided by third-parties. As such, MyEListing will not be responsible for the accuracy of the information. It is strongly recommended that you verify all information with the listing agent, and any relevant agencies, prior to making any decisions.


