Multifamily Housing
1629 Washington Avenue New Orleans, LA 70130
1629 Washington Avenue New Orleans, LA 70130
Details & Description
Property Highlights
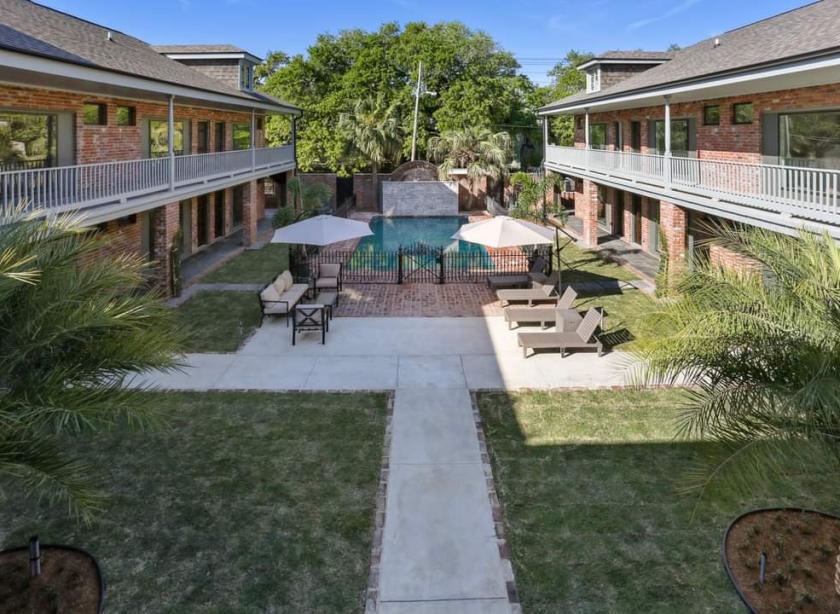
• completely renovated 25 unit condo complex from top to bottom 19 one bedrooms 5 two bedrooms 1 three bedroom
• has swimming pool , courtyard , lounge deck gated private off street parking
Additional Photos


Listing Agents

austin venture
newkey317@gmail.com
newkey317@gmail.com
While we strive to provide the most accurate information, all listing information, and demographic data, is provided by third-parties. As such, MyEListing will not be responsible for the accuracy of the information. It is strongly recommended that you verify all information with the listing agent, and any relevant agencies, prior to making any decisions.


