Office Space
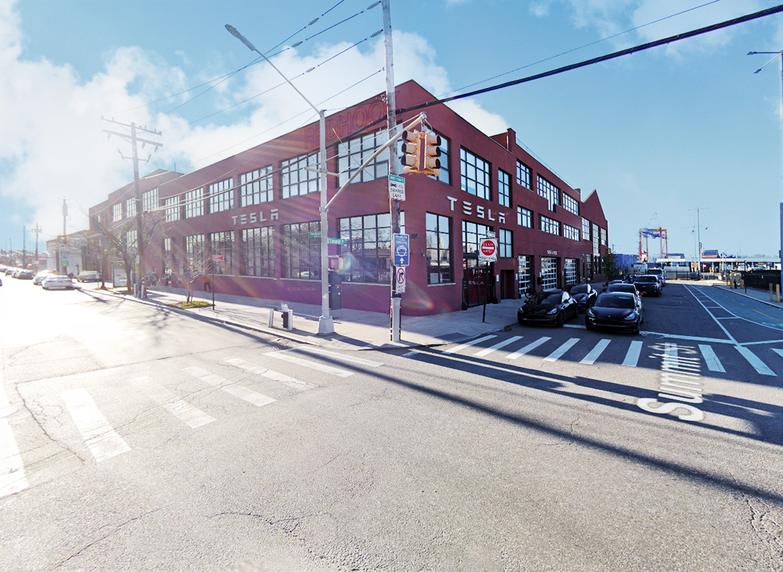
160 Van Brunt Street Brooklyn, NY 11231
160 Van Brunt Street Brooklyn, NY 11231
Details & Description
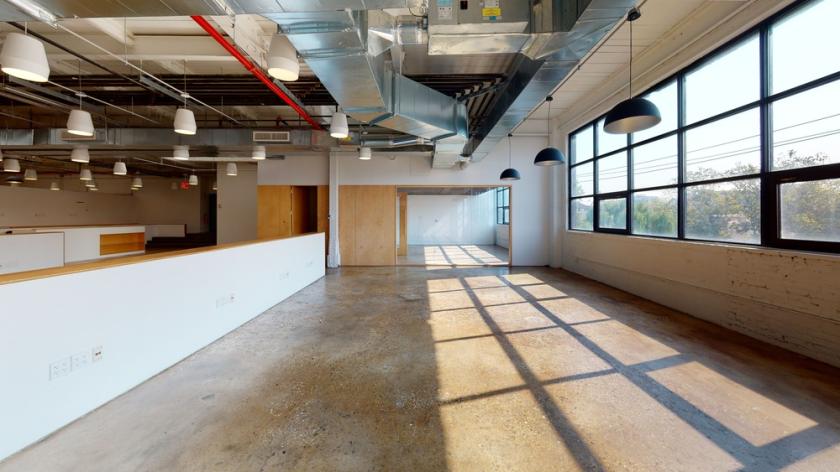
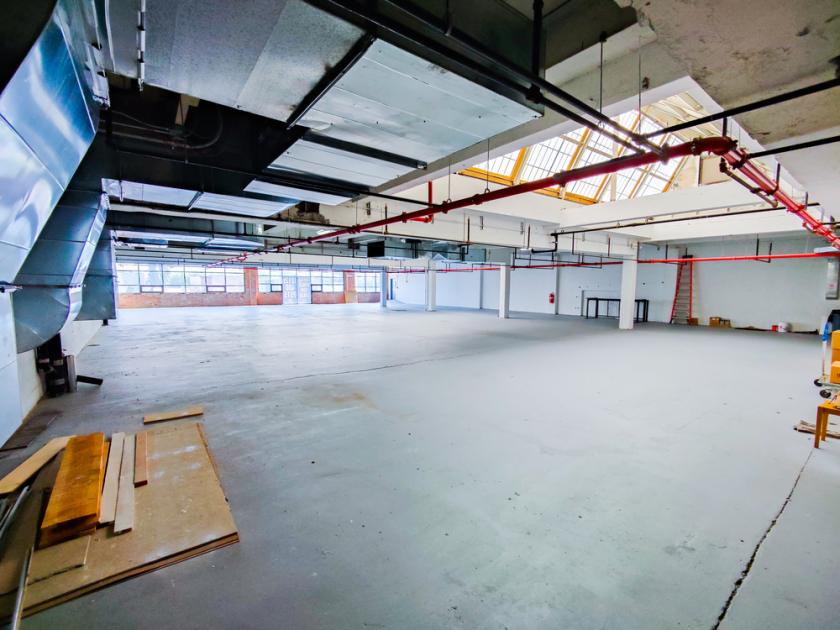
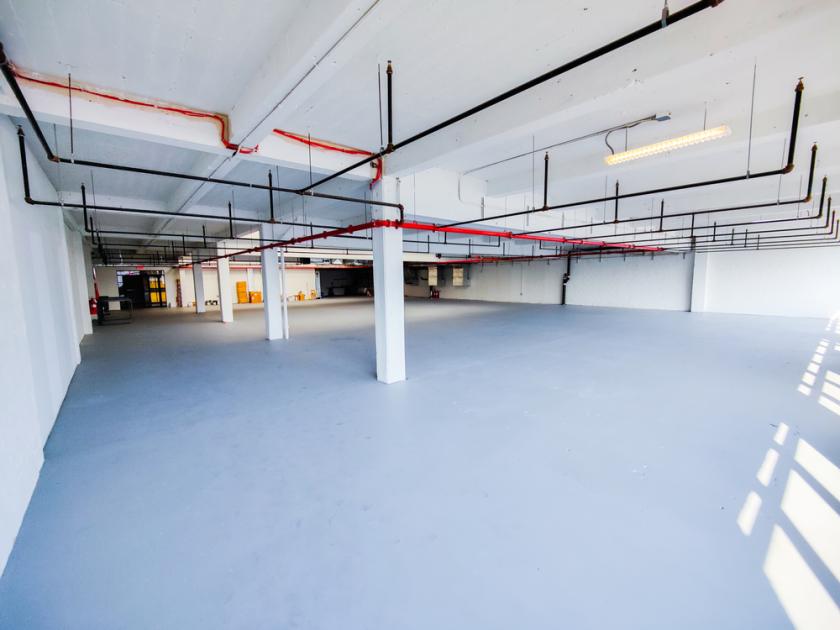
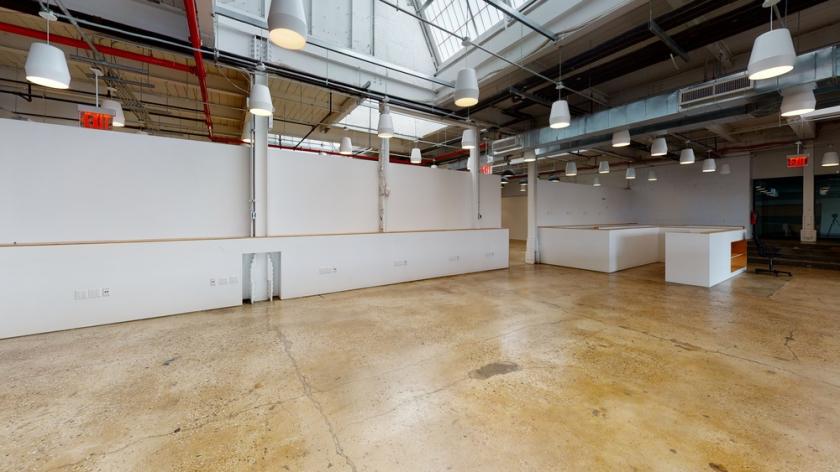
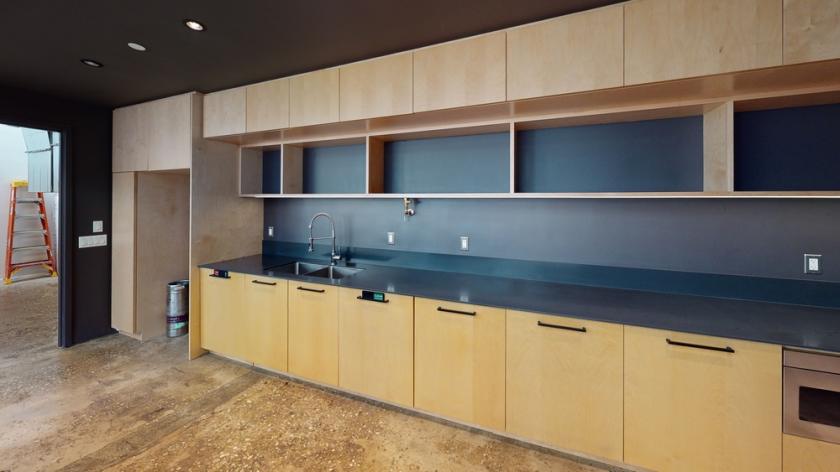
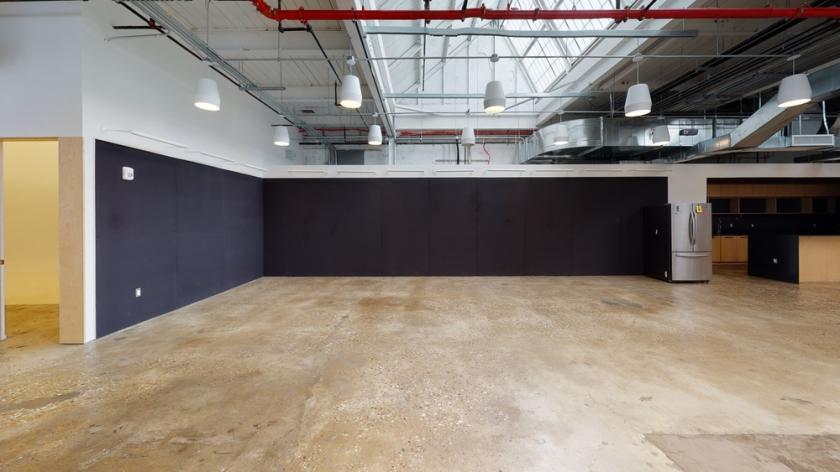
Property Highlights
- • Located in the Tesla Building -
- • Waterfront office and loft space
- • Proximity to the water taxi
- • Rooftop event space in the building
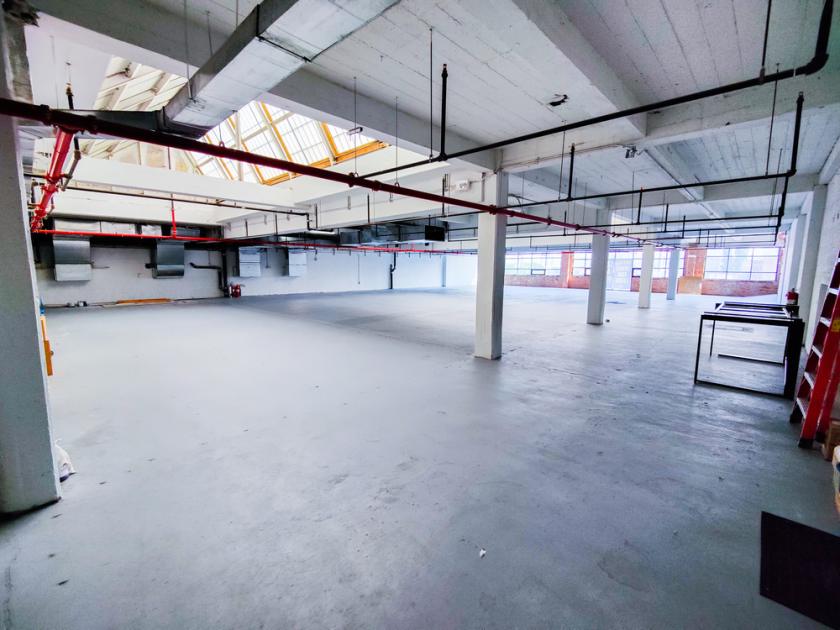
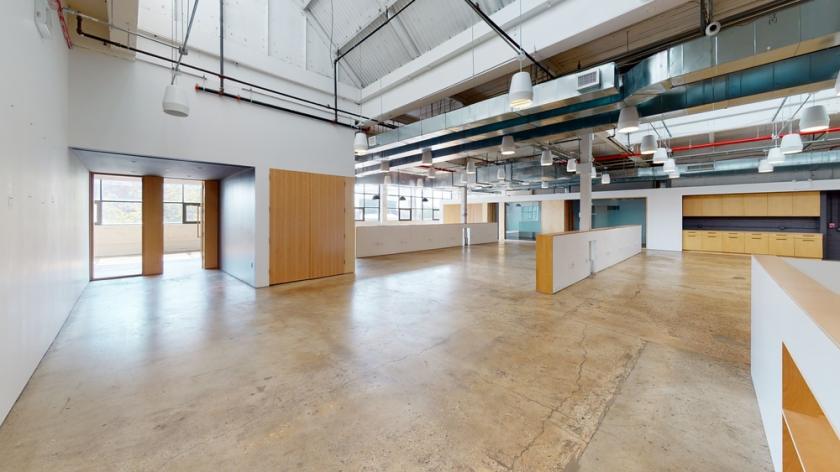
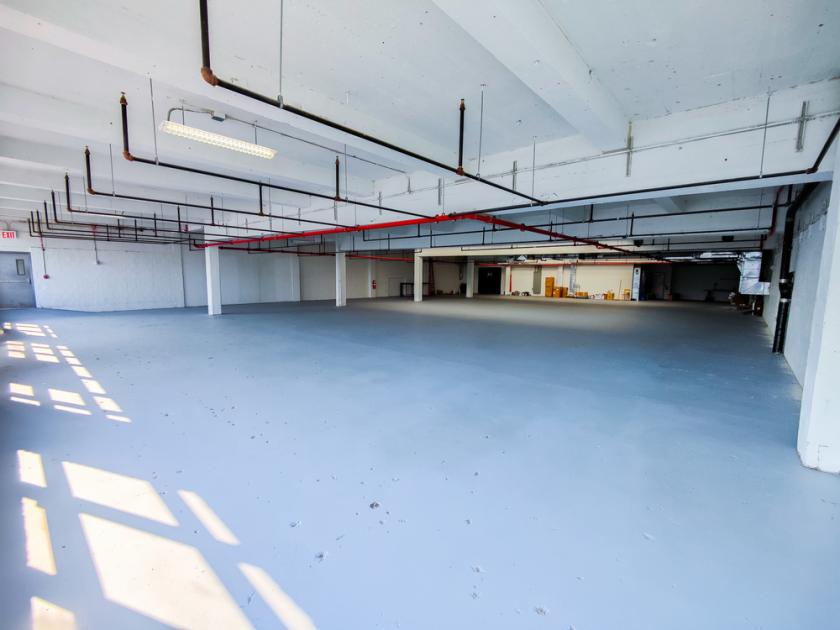
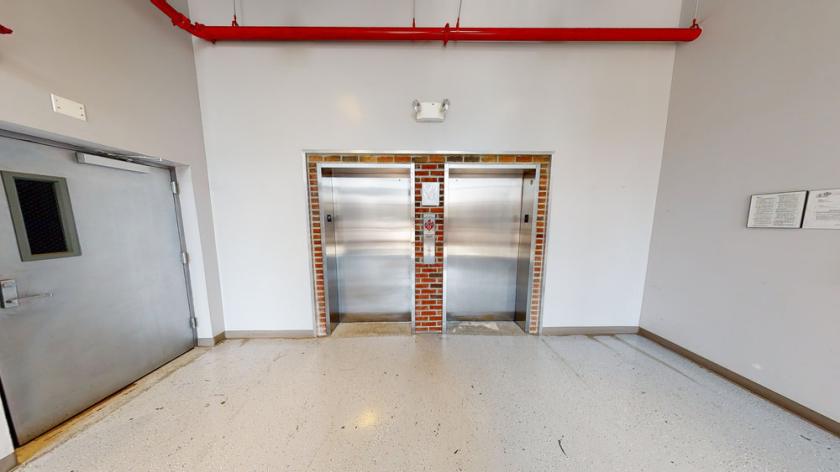
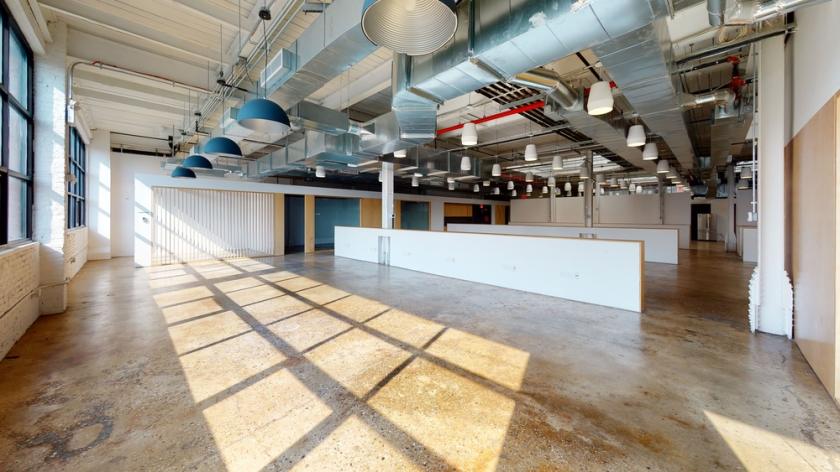
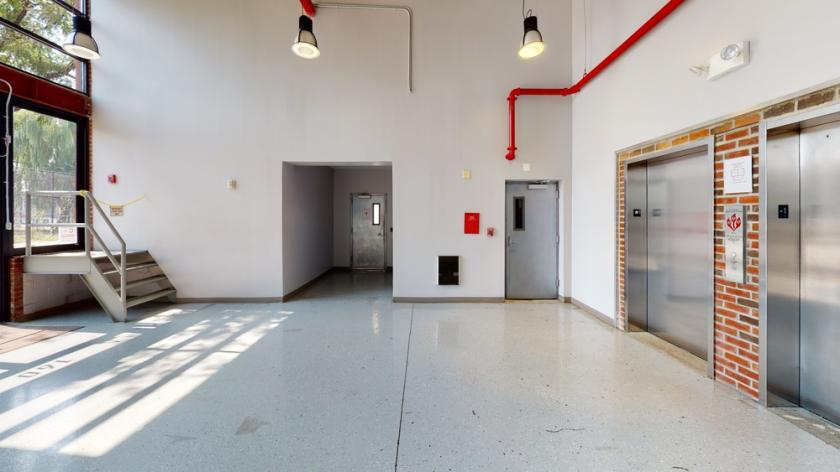
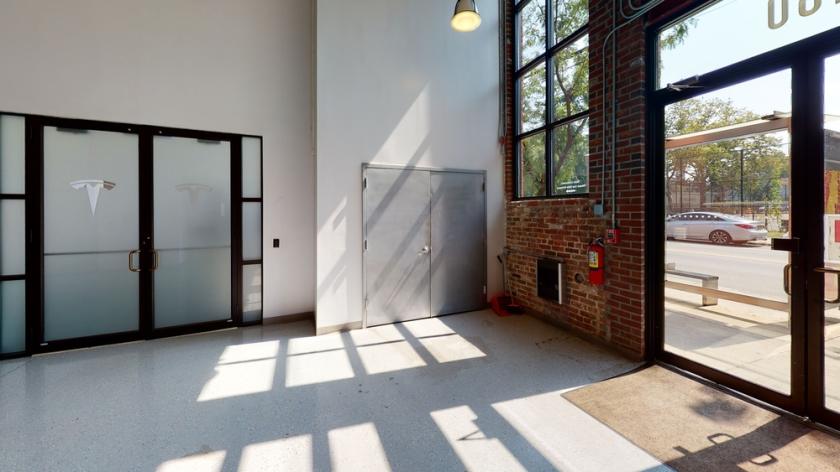
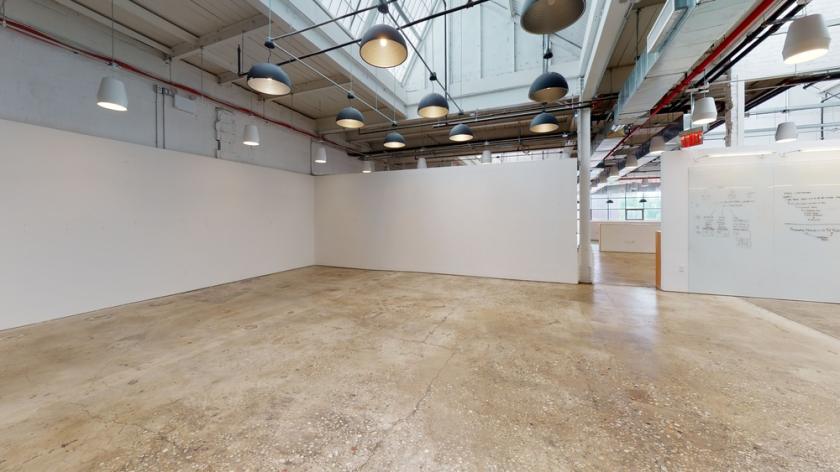
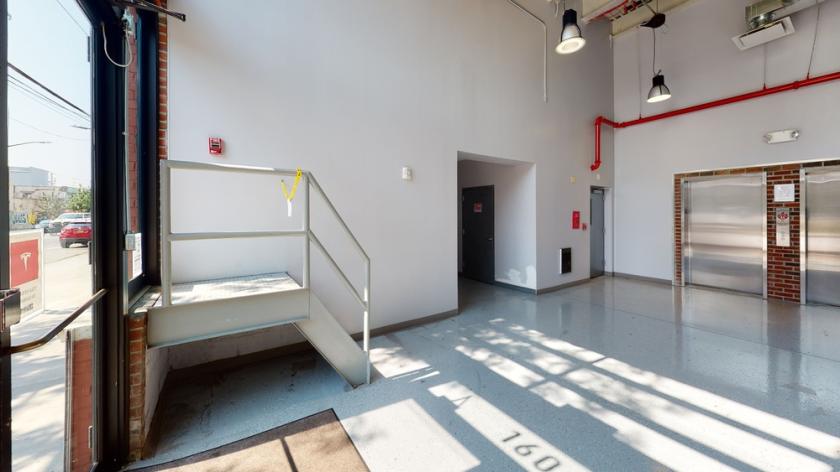
Additional Photos

Listing Agents

Shlomi Bagdadi
O: 718-437-6100
info@tristatecr.com
O: 718-437-6100
info@tristatecr.com
While we strive to provide the most accurate information, all listing information, and demographic data, is provided by third-parties. As such, MyEListing will not be responsible for the accuracy of the information. It is strongly recommended that you verify all information with the listing agent, and any relevant agencies, prior to making any decisions.