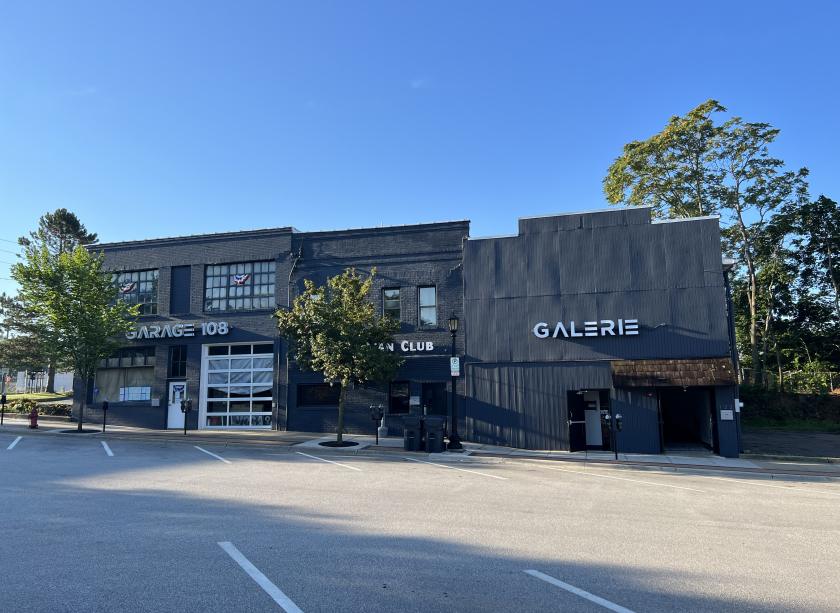
Commercial Property Mixed Uses For Sale: 108-122 W. College Street Kent, OH 44240
Parking Lot: PIN 17-025-40-00-055-001
108 Building: PIN 17-025-40-00-056-000
112 Upstairs: Lease Available
122 Building: PIN 17-025-40-00-058-000
CONTACT: Valerie Landis 312-479-2427 garage108kent@gmail.com
• Grandfather-in Liquor License Available, 9+ Parking Spots, Land Survey Completed, Architect Plans Created, Assembly Use A2-A3, Commercial Kitchen Appliances, City Approvals and Regulations (ARB, Zoning, Planning Commission) Obtained
• Two-story buildings 108-112-122 W. College Street with mezzanine, loading dock, and parking lot
• 108 Building 1st Floor: 3,150 square feet; 17’ ceiling height + 2nd Floor: 3,150 square feet; 12’ ceiling height
• 112 Building 2nd Floor: 2,150 square feet; 12’ ceiling height
• 122 Building 1st Floor: 3,000 square feet; 15’ ceiling height + 2nd Floor: 2,000 square feet; 10’ ceiling height
• Ideal uses include store retail, flex-warehouse, creative office, office space, storage, manufacturing, storefront, cafe, restaurant, speakeasy, bar, commercial kitchen, club, nightclub, event center activities, fitness, health club, co-working hub, coworking spaces, wedding venue, event venue
• Attached surface parking lot with abundant street parking
• ADA bathrooms
• Owner has completed and planned many improvements to the building, has architectural plans for approval, and obtained many city approvals
• New Tundra™ Silicone roof (2020)
• Tuckpointed and filled in any brick and building cracks (2020)
• Painted all exterior sides of the buildings 108-122 W. College (2020)
• Landscaping, ground leveling, run-off water prevention, weed removal, tree trimming/removal, tarped and mulched (2020)
• New garage doors installed on both front and back spaces (2021)
• Corner lot at a signalized intersection in Downtown Kent
• Excellent location near local retail, businesses, and Kent State University
•City incentives include a tax abatement program, CRA Pre-1994, and a revolving loan fund