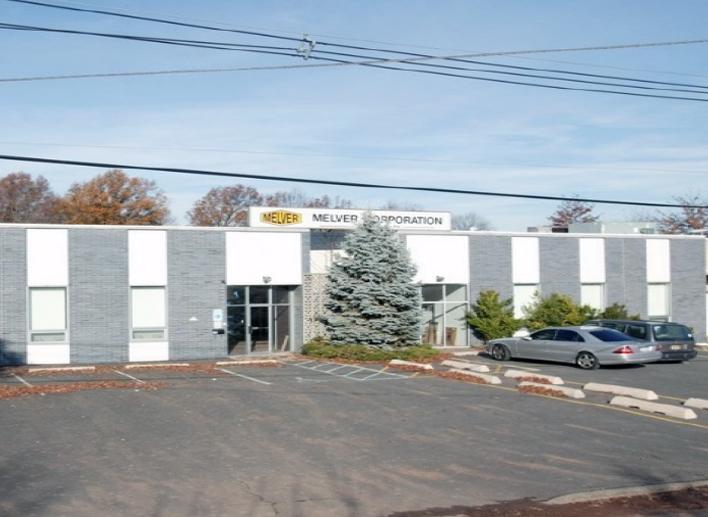
Building: ±41,802 SF
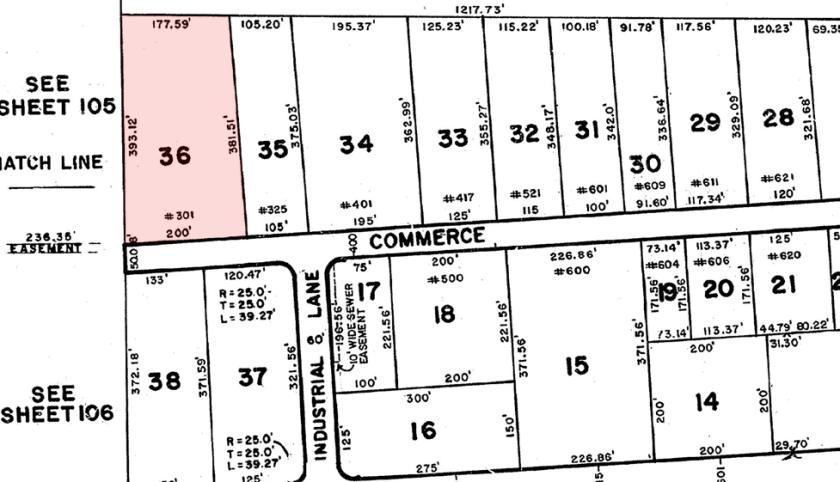
Acreage: ±1.75 Acres (Block 439, Lot 36)
Ceiling: 21' Clear Height
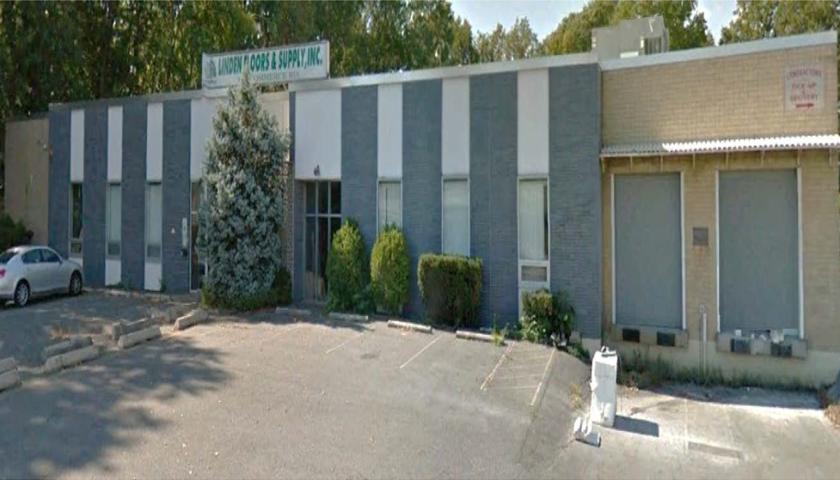
Loading: 2 Docks, 1 Drive-In
Heat: Suspended Gas Fired Blowers
Sprinkler: Wet System
Power: 3-Phase | 2,000 Amps
Zoning: Industrial (LI)
Taxes: $43,316.21 (2022)
Less Than 1 Mile to NJ Transit Train at Linden Station
Approx. 1 Miles to I-278
Approx. 1.5 Miles to I-95
Approx. 5.8 Miles to Goethals Bridge
Approx. 8 Miles to Newark Liberty International Airport
Approx. 16.1 Miles to Holland Tunnel
Approx. 19.7 Miles to Lincoln Tunnel
No part of this information may be copied, reproduced, repurposed, or screen-captured for any commercial purpose without prior written authorization from MyEListing.
While we strive to provide the most accurate information, all listing information, and demographic data, is provided by third-parties. As such, MyEListing will not be responsible for the accuracy of the information. It is strongly recommended that you verify all information with the listing agent, and any relevant agencies, prior to making any decisions.
What is the building size of this commercial Industrial property?
The size of this lease property at '.301 Commerce Road.' is 41802 square feet
What kind of Industrial is the propery at 301 Commerce Road?
The property at 301 Commerce Road Linden, NJ 07036 is listed as a Manufacturing Industrial property
What is the population within 1 mile of 301 Commerce Road in Linden?
The population within 1 mile of 301 Commerce Road Linden, NJ 07036 is 18,719 people.
Who do I contact for questions about 301 Commerce Road?
You should contact the listing agent,
Jason M. Crimmins , for any details regarding this commercial listing.