Flex-Office-Warehouse
11001 Bluegrass Parkway Louisville, KY 40299
11001 Bluegrass Parkway Louisville, KY 40299
Details & Description
Property Highlights
- • 3 Free Months of Rent
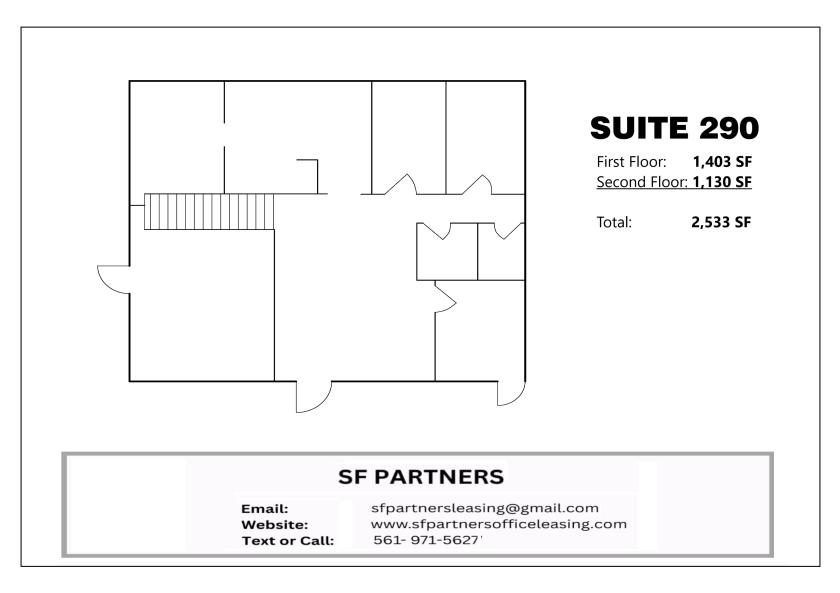
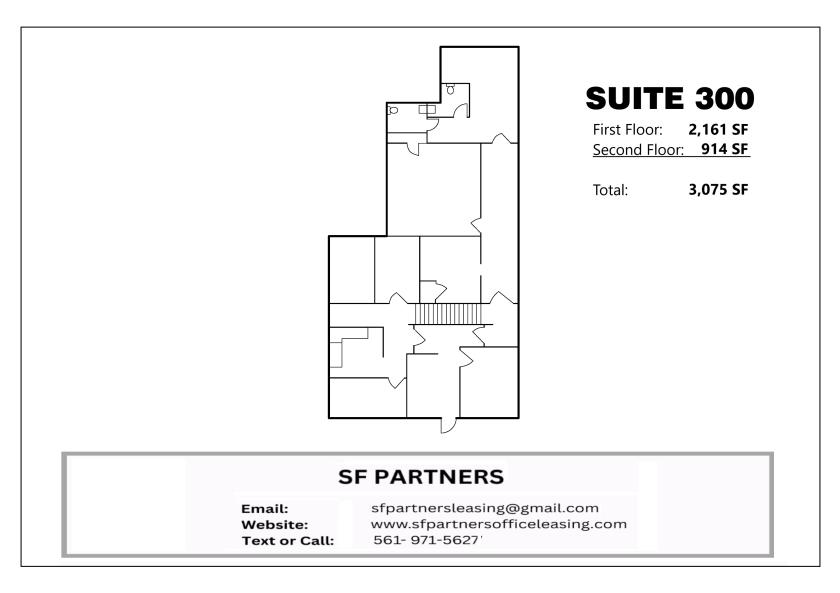
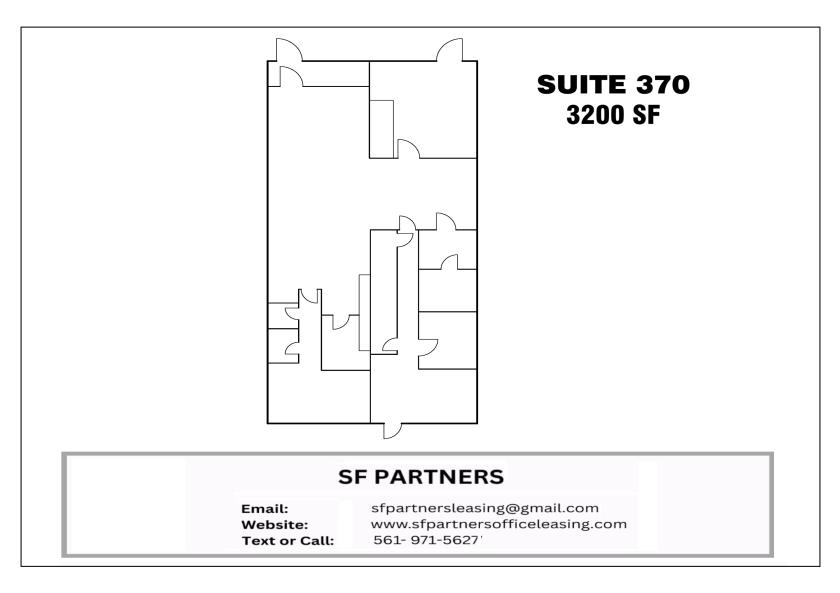
- • Office Space for Lease
- • Available Now
Additional Photos
Listing Agents

Richard Armstrong
O: 561-971-5627
cheska@officeleasing.onmicrosoft.com
O: 561-971-5627
cheska@officeleasing.onmicrosoft.com
While we strive to provide the most accurate information, all listing information, and demographic data, is provided by third-parties. As such, MyEListing will not be responsible for the accuracy of the information. It is strongly recommended that you verify all information with the listing agent, and any relevant agencies, prior to making any decisions.


