Retail Space
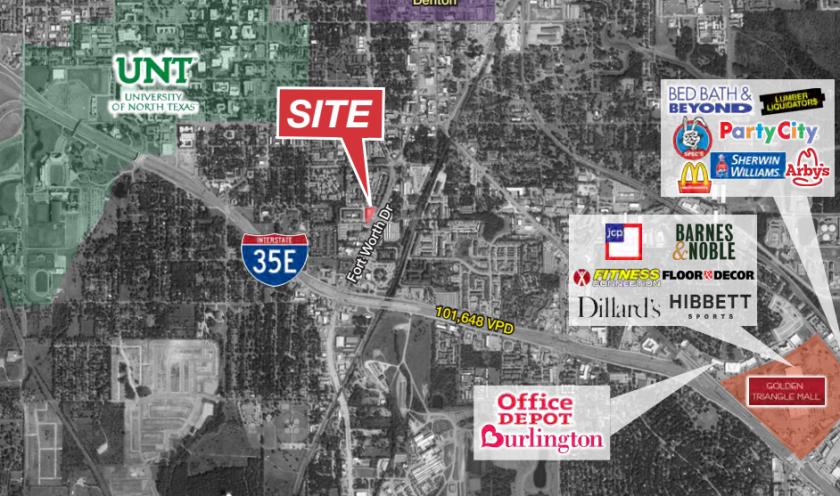
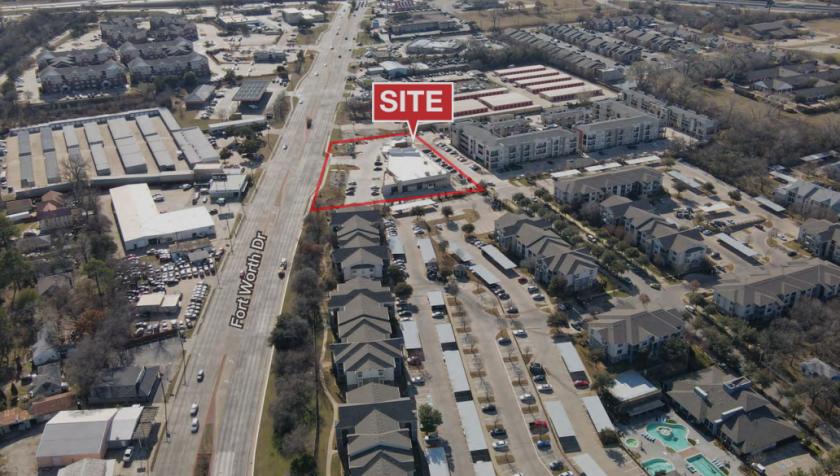
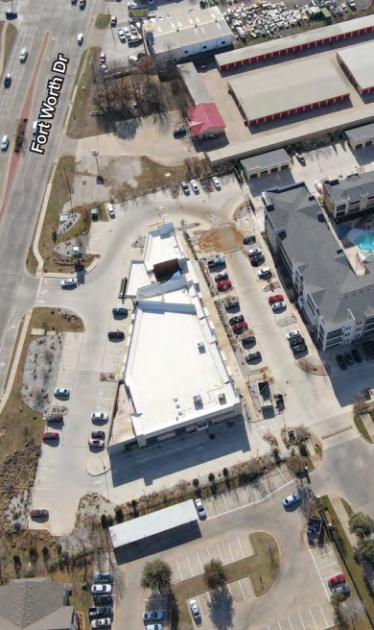
500 Fort Worth Drive Denton, TX 76201
500 Fort Worth Drive Denton, TX 76201

Details & Description
Property Highlights
- • BUILT-IN UPSIDE
- • LONG AVERAGE LEASE TERM
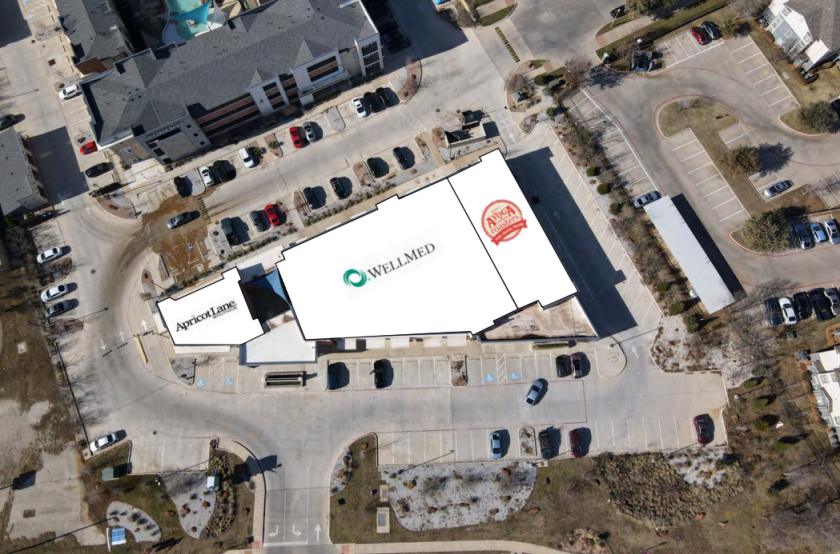
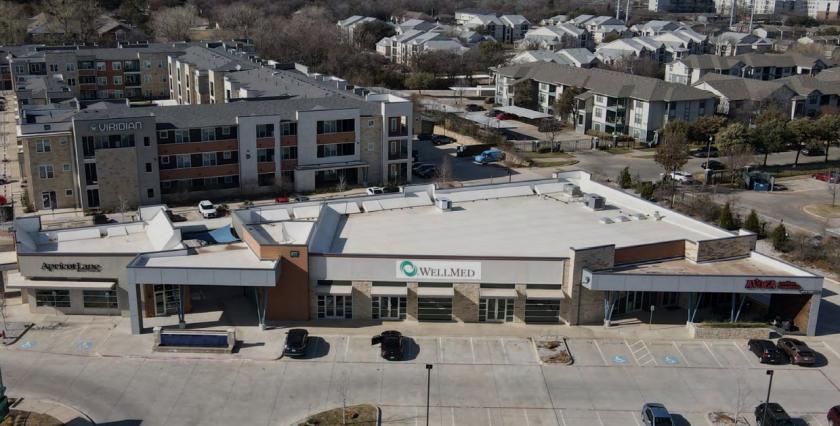
- • NEW CLASS A CONSTRUCTION
- • EXCELLENT VISIBILITY WITH EASE OF ACCESS
- • STRONG OPERATOR CREDIT
- • COMPLIMENTARY TENANT LINE-UP
Additional Photos


Listing Agents

Sam House
O: 214-256-7171
M: 817-944-6824
shouse@nairl.com
O: 214-256-7171
M: 817-944-6824
shouse@nairl.com

Justin Glover
O: 817-872-3921
M: 832-630-8003
jglover@nairl.com
O: 817-872-3921
M: 832-630-8003
jglover@nairl.com
While we strive to provide the most accurate information, all listing information, and demographic data, is provided by third-parties. As such, MyEListing will not be responsible for the accuracy of the information. It is strongly recommended that you verify all information with the listing agent, and any relevant agencies, prior to making any decisions.