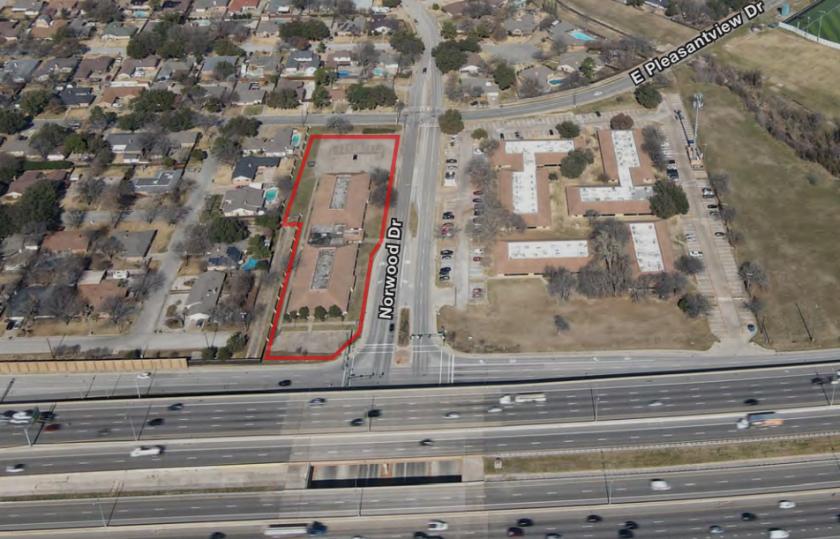
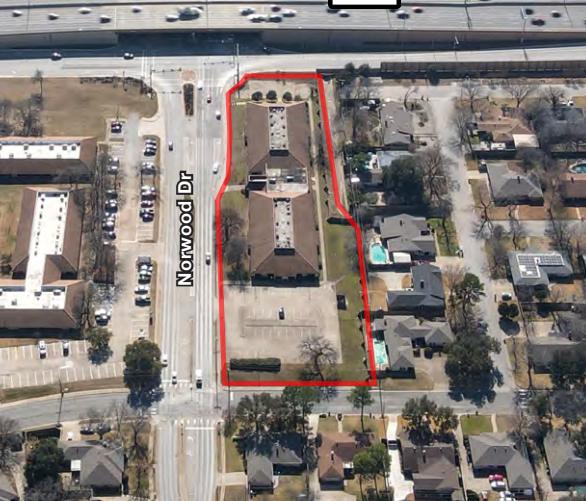
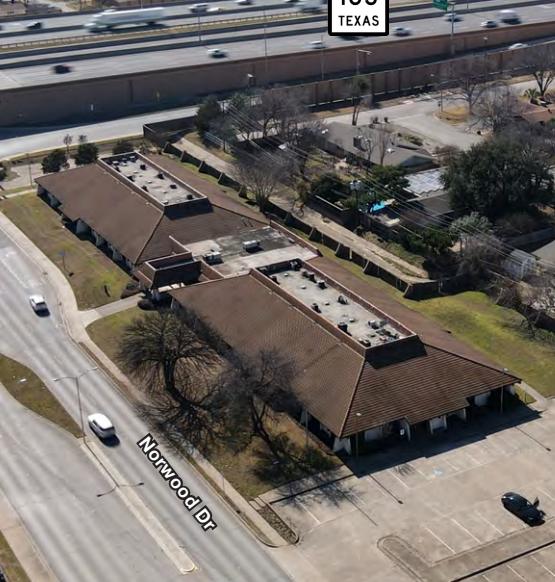
1-Mile | 3-Miles | 5-Miles | ||
---|---|---|---|---|
Total Population | 12,662 | 113,880 | 248,711 | |
Population Median Age | 38 | 39 | 39 | |
Population by Age | 0-9 Yrs | 2026 (16%) | 14053 (12%) | 31299 (12%) |
10-19 Yrs | 1596 (12%) | 14738 (12%) | 32280 (12%) | |
20-29 Yrs | 1216 (9%) | 15216 (13%) | 31163 (12%) | |
30-39 Yrs | 1808 (14%) | 15793 (13%) | 33091 (13%) | |
40-49 Yrs | 1693 (13%) | 14214 (12%) | 32428 (13%) | |
50-59 Yrs | 1465 (11%) | 13097 (11%) | 33116 (13%) | |
60-69 Yrs | 1360 (10%) | 13716 (12%) | 30685 (12%) | |
70+ Yrs | 1499 (11%) | 13053 (11%) | 24651 (9%) | |
Median HH Income | $73,457 | $68,242 | $77,514 | |
Total Household Income | < 24K | 579 (12%) | 4778 (10%) | 9320 (10%) |
25-49K | 974 (20%) | 10529 (24%) | 18745 (20%) | |
50-74K | 832 (17%) | 8877 (20%) | 16968 (18%) | |
75-99K | 675 (14%) | 5907 (13%) | 12934 (13%) | |
100-199K | 1415 (30%) | 10721 (24%) | 25800 (27%) | |
200K+ | 191 (4%) | 2893 (6%) | 8901 (9%) | |
Highest Education Level | No Diploma | 797 | 6190 | 13203 |
Diploma or GED | 2177 | 16824 | 35846 | |
Some College | 2194 | 20481 | 42918 | |
Assoc. Degree | 694 | 7907 | 15229 | |
Bachelors Degree | 1842 | 18162 | 42990 | |
Higher Degree | 833 | 8656 | 21068 | |
Total Housing Units | 4,930 | 46,757 | 97,924 | |
--Owner-Occupied | 2,956 | 24,144 | 59,494 | |
--Renter-Occupied | 1,712 | 19,561 | 33,174 | |
Owner-Occupied Values | < 100K | 203 | 1324 | 3794 |
100-199K | 1075 | 8171 | 17979 | |
200-299K | 1182 | 7858 | 18163 | |
300-399K | 334 | 3952 | 8275 | |
400-499K | 100 | 1735 | 5406 | |
500K+ | 61 | 1104 | 5878 | |
Total Working Age Population | 9,621 | 89,841 | 196,143 | |
In Work Force | 6,632 | 61,011 | 135,558 | |
Not In Work Force | 2,989 | 28,830 | 60,585 | |
Workforce Employed | 6,465 | 58,841 | 130,177 | |
Workforce Unemployed | 167 | 2,158 | 5,308 | |
Civlian Workforce | 6,632 | 61,000 | 135,485 | |
Military Workforce | 0 | 11 | 73 | |
Total Households | 4,668 | 43,705 | 92,668 | |
Family Households | 3,085 | 28,582 | 64,688 | |
Non-Family Households | 1,582 | 15,123 | 27,980 | |
Married Couple | 2,376 | 20,840 | 49,123 | |
Other Family | 709 | 7,742 | 15,566 | |
Married w/Child | 1,022 | 7,821 | 19,091 | |
Single Male w/Child | 117 | 787 | 1,803 | |
Single Female w/Child | 295 | 3,721 | 6,384 |
Population Change Last Two Decades - Plus Projection
2000 | % | 2010 | % | 2020 | % | 2030 | |
---|---|---|---|---|---|---|---|
Texas | 20,851,820 | +21 | 25,145,561 | +18 | 29,677,668 | +18 | 34,894,452 |
Tarrant County | 1,446,219 | +25 | 1,809,034 | +19 | 2,143,755 | +17 | 2,507,170 |
Total Working Age Population:
Total Households:
Total Working Age Population:
Total Households:
Total Working Age Population:
Total Households: