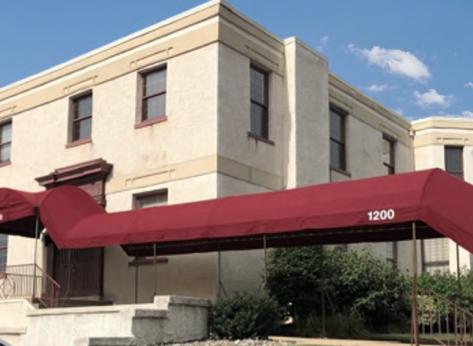
1-Mile | 3-Miles | 5-Miles | ||
---|---|---|---|---|
Total Population | 31,139 | 108,685 | 186,489 | |
Population Median Age | 39 | 38 | 39 | |
Population by Age | 0-9 Yrs | 2965 (9%) | 12897 (11%) | 22194 (11%) |
10-19 Yrs | 3390 (10%) | 13781 (12%) | 23730 (12%) | |
20-29 Yrs | 5853 (18%) | 16175 (14%) | 24654 (13%) | |
30-39 Yrs | 4961 (15%) | 16261 (14%) | 26549 (14%) | |
40-49 Yrs | 3179 (10%) | 12158 (11%) | 21993 (11%) | |
50-59 Yrs | 3701 (11%) | 14490 (13%) | 25247 (13%) | |
60-69 Yrs | 3795 (12%) | 12669 (11%) | 22062 (11%) | |
70+ Yrs | 3294 (10%) | 10254 (9%) | 20058 (10%) | |
Median HH Income | $48,559 | $52,078 | $60,955 | |
Total Household Income | < 24K | 4058 (27%) | 11749 (26%) | 15903 (21%) |
25-49K | 3435 (23%) | 10126 (22%) | 15750 (21%) | |
50-74K | 2522 (17%) | 7295 (16%) | 12108 (16%) | |
75-99K | 1375 (9%) | 5211 (11%) | 8944 (12%) | |
100-199K | 2395 (16%) | 7698 (17%) | 15787 (21%) | |
200K+ | 882 (6%) | 2902 (6%) | 5671 (7%) | |
Highest Education Level | No Diploma | 2645 | 8288 | 13692 |
Diploma or GED | 7106 | 26762 | 43979 | |
Some College | 3528 | 12667 | 22400 | |
Assoc. Degree | 1005 | 4707 | 8122 | |
Bachelors Degree | 4701 | 13456 | 24542 | |
Higher Degree | 3382 | 9755 | 18154 | |
Total Housing Units | 16,990 | 50,491 | 81,627 | |
--Owner-Occupied | 5,988 | 22,707 | 45,308 | |
--Renter-Occupied | 8,679 | 22,273 | 28,854 | |
Owner-Occupied Values | < 100K | 905 | 2883 | 4075 |
100-199K | 1914 | 9069 | 15139 | |
200-299K | 1437 | 5105 | 11922 | |
300-399K | 945 | 2167 | 6242 | |
400-499K | 293 | 1033 | 3108 | |
500K+ | 494 | 2450 | 4822 | |
Total Working Age Population | 25,699 | 87,053 | 149,226 | |
In Work Force | 17,244 | 55,991 | 95,003 | |
Not In Work Force | 8,455 | 31,062 | 54,223 | |
Workforce Employed | 15,885 | 51,202 | 87,642 | |
Workforce Unemployed | 1,275 | 4,611 | 7,045 | |
Civlian Workforce | 17,160 | 55,813 | 94,686 | |
Military Workforce | 84 | 178 | 317 | |
Total Households | 14,667 | 44,980 | 74,163 | |
Family Households | 6,004 | 22,877 | 42,380 | |
Non-Family Households | 8,663 | 22,103 | 31,783 | |
Married Couple | 3,035 | 12,435 | 26,539 | |
Other Family | 2,970 | 10,443 | 15,841 | |
Married w/Child | 835 | 4,278 | 9,088 | |
Single Male w/Child | 300 | 994 | 1,776 | |
Single Female w/Child | 1,261 | 4,434 | 6,195 |
Population Change Last Two Decades - Plus Projection
2000 | % | 2010 | % | 2020 | % | 2030 | |
---|---|---|---|---|---|---|---|
Delaware | 783,600 | +15 | 897,934 | +10 | 989,803 | +6 | 1,044,965 |
New Castle County | 500,265 | +8 | 538,479 | +6 | 571,165 | +4 | 596,221 |
New Jersey | 8,414,350 | +4 | 8,791,894 | +4 | 9,132,700 | +4 | 9,530,900 |
Salem County | 64,285 | +3 | 66,083 | -5 | 63,000 | -3 | 61,000 |
Total Working Age Population:
Total Households:
Total Working Age Population:
Total Households:
Total Working Age Population:
Total Households: