Commercial Land
503 Santee Road Durham, NC 27704
503 Santee Road Durham, NC 27704
Details & Description
Property Highlights
• Close to lake, golf course, RTP, airport, and shopping
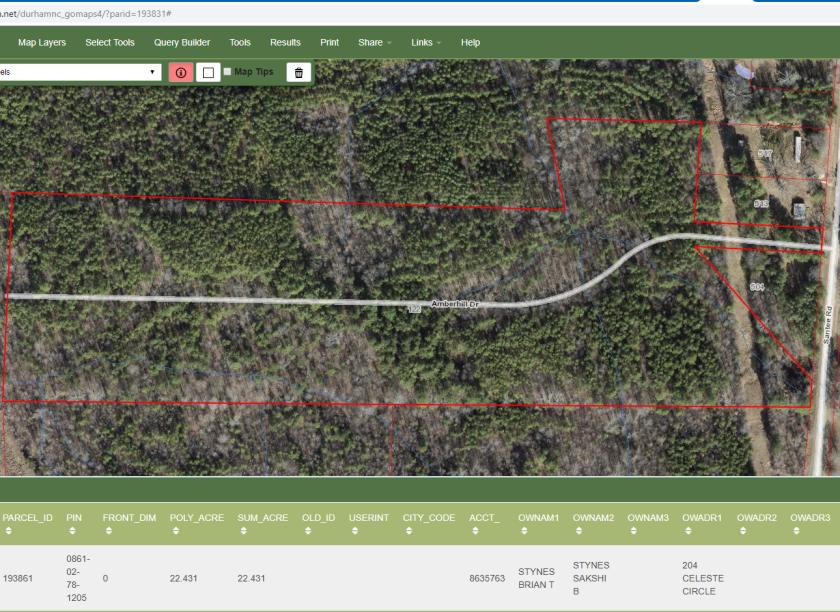
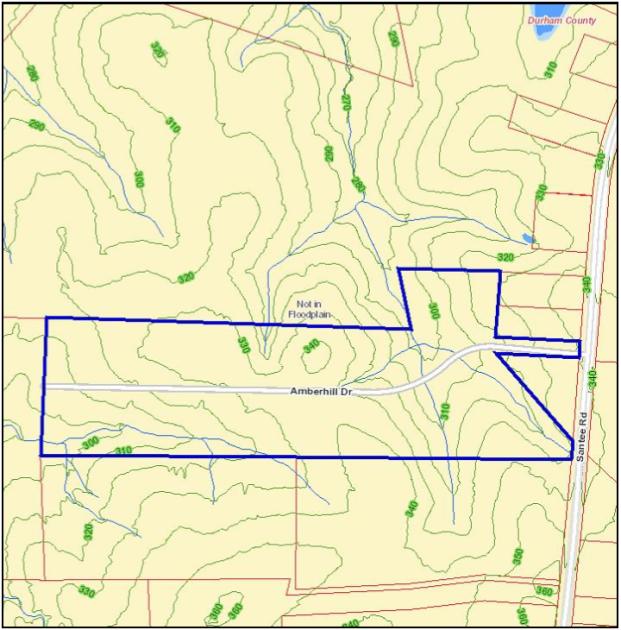
• Beautiful rolling topography with multiple homesites
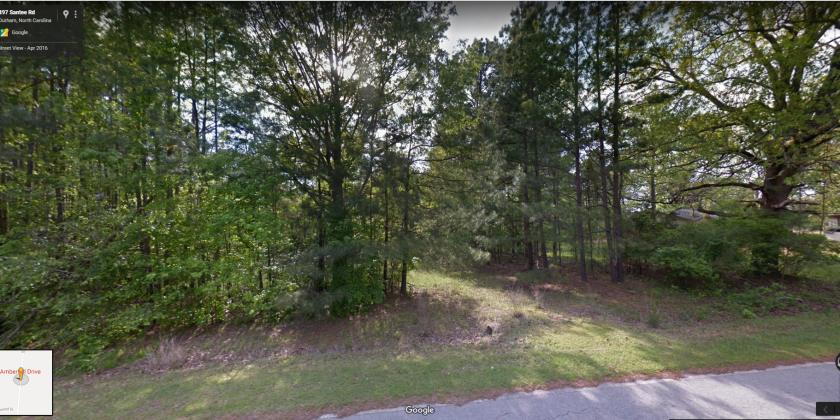
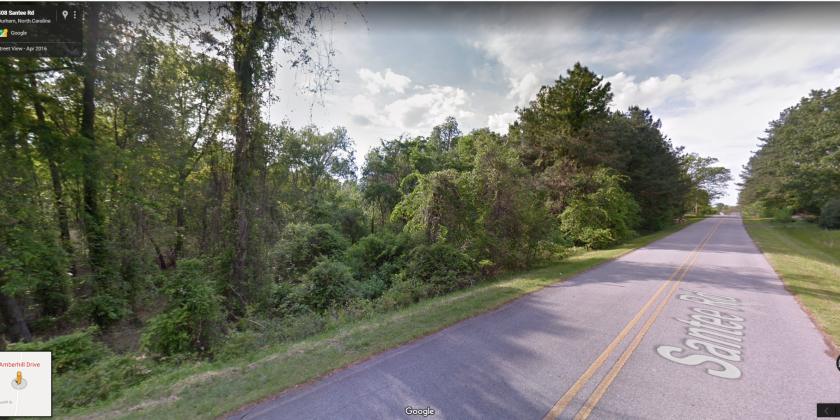
Additional Photos

Listing Agents

Brian Stynes
btstynes@gmail.com
btstynes@gmail.com
While we strive to provide the most accurate information, all listing information, and demographic data, is provided by third-parties. As such, MyEListing will not be responsible for the accuracy of the information. It is strongly recommended that you verify all information with the listing agent, and any relevant agencies, prior to making any decisions.


