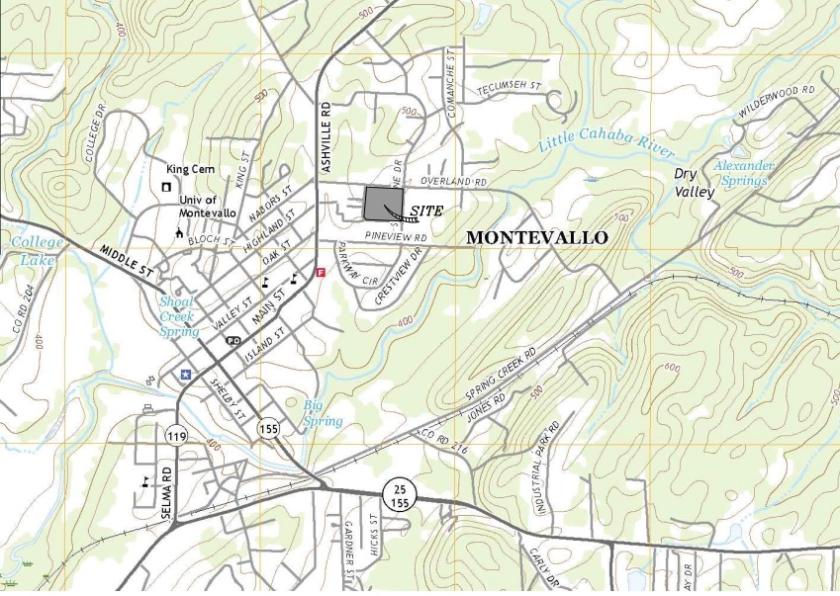
1-Mile | 3-Miles | 5-Miles | ||
---|---|---|---|---|
Total Population | 1,972 | 7,399 | 18,267 | |
Population Median Age | 30 | 37 | 37 | |
Population by Age | 0-9 Yrs | 57 (2%) | 559 (7%) | 2035 (11%) |
10-19 Yrs | 618 (31%) | 1323 (17%) | 2696 (14%) | |
20-29 Yrs | 777 (39%) | 1800 (24%) | 3024 (16%) | |
30-39 Yrs | 33 (1%) | 425 (5%) | 2239 (12%) | |
40-49 Yrs | 120 (6%) | 1008 (13%) | 2799 (15%) | |
50-59 Yrs | 110 (5%) | 796 (10%) | 1888 (10%) | |
60-69 Yrs | 144 (7%) | 831 (11%) | 2057 (11%) | |
70+ Yrs | 112 (5%) | 657 (8%) | 1530 (8%) | |
Median HH Income | $34,695 | $38,430 | $51,992 | |
Total Household Income | < 24K | 109 (25%) | 849 (32%) | 1698 (24%) |
25-49K | 152 (36%) | 755 (28%) | 1622 (23%) | |
50-74K | 64 (15%) | 412 (15%) | 1240 (18%) | |
75-99K | 30 (7%) | 209 (7%) | 653 (9%) | |
100-199K | 56 (13%) | 363 (13%) | 1462 (21%) | |
200K+ | 10 (2%) | 39 (1%) | 159 (2%) | |
Highest Education Level | No Diploma | 48 | 586 | 1274 |
Diploma or GED | 151 | 1208 | 3393 | |
Some College | 146 | 927 | 2506 | |
Assoc. Degree | 82 | 516 | 1281 | |
Bachelors Degree | 108 | 610 | 2229 | |
Higher Degree | 52 | 278 | 952 | |
Total Housing Units | 460 | 2,915 | 7,338 | |
--Owner-Occupied | 262 | 1,668 | 5,001 | |
--Renter-Occupied | 160 | 957 | 1,833 | |
Owner-Occupied Values | < 100K | 33 | 443 | 952 |
100-199K | 186 | 975 | 2753 | |
200-299K | 18 | 106 | 999 | |
300-399K | 9 | 55 | 120 | |
400-499K | 9 | 38 | 48 | |
500K+ | 7 | 51 | 129 | |
Total Working Age Population | 1,871 | 6,465 | 15,008 | |
In Work Force | 885 | 3,590 | 9,247 | |
Not In Work Force | 986 | 2,876 | 5,761 | |
Workforce Employed | 780 | 3,285 | 8,677 | |
Workforce Unemployed | 104 | 297 | 548 | |
Civlian Workforce | 883 | 3,582 | 9,226 | |
Military Workforce | 1 | 8 | 21 | |
Total Households | 421 | 2,625 | 6,833 | |
Family Households | 184 | 1,462 | 4,285 | |
Non-Family Households | 237 | 1,163 | 2,548 | |
Married Couple | 145 | 1,026 | 3,186 | |
Other Family | 39 | 436 | 1,099 | |
Married w/Child | 34 | 246 | 1,202 | |
Single Male w/Child | 1 | 10 | 63 | |
Single Female w/Child | 9 | 131 | 436 |
Population Change Last Two Decades - Plus Projection
2000 | % | 2010 | % | 2020 | % | 2030 | |
---|---|---|---|---|---|---|---|
Alabama | 4,447,100 | +7 | 4,779,736 | +3 | 4,940,253 | +4 | 5,124,380 |
Shelby County | 143,293 | +36 | 195,085 | +15 | 224,628 | +13 | 253,485 |
Chilton County | 39,593 | +10 | 43,643 | +2 | 44,308 | +2 | 45,388 |
Bibb County | 20,826 | +10 | 22,915 | -2 | 22,354 | -1 | 22,023 |
Total Working Age Population:
Total Households:
Total Working Age Population:
Total Households:
Total Working Age Population:
Total Households: