Looking for 1 tenant for all 6,720 sq ft per month available to rent.
$2.00 per sq ft per month
6,720 total sq ft available for rent
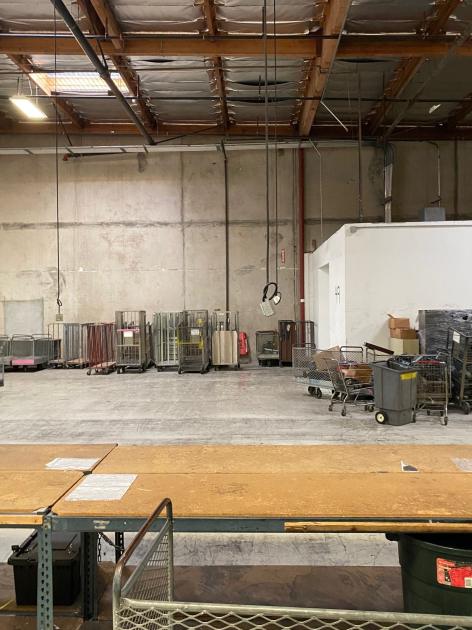
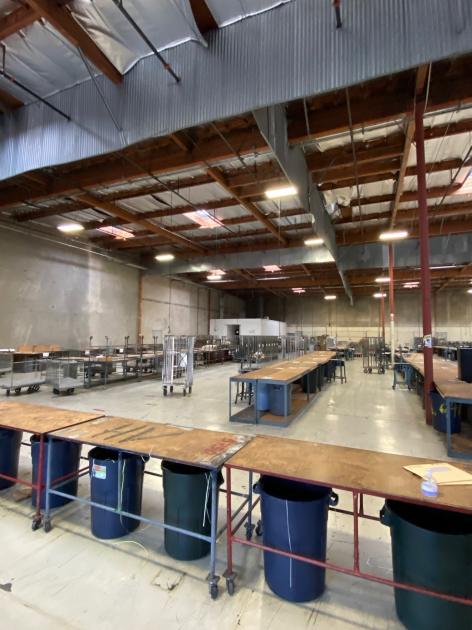
This is shared warehouse space
- This warehouse allows labor and storage inside
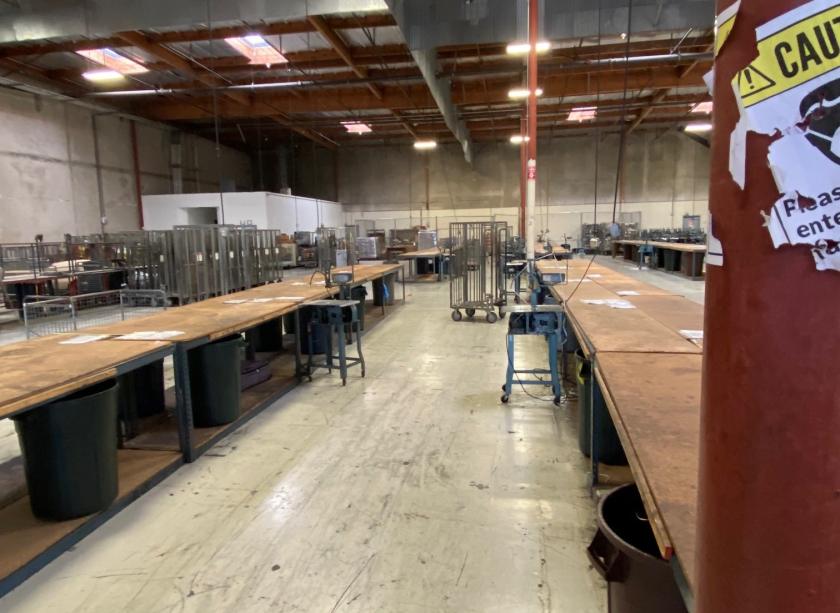
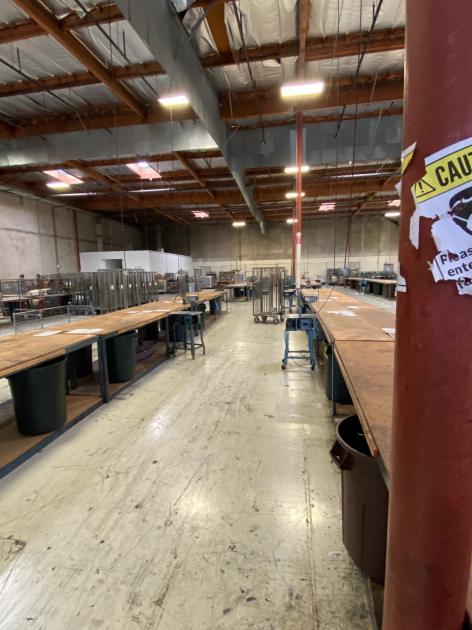
- Perfect Warehouse in a great location. Right off the 5 Freeway in Irvine.
- You can work in this space! Build your business here!
There is a ground level door and 25' ceilings. This is shared space but you will be separated with a partition on from the other users. There is lots of drop power for you.
Lots of Parking. A dock high may be available.
- This is a shared space warehouse
- No public access allowed
Book a tour or view full warehouse details here: https://www.warehouseexchange.com/warehouse/870
If you are interested in this facility please fill out the form below, it is sent directly to me. I will have the tenant manager respond back to you to book a tour to see the space and discuss pricing: https://share.hsforms.com/1ZK3ynKGAQb6AkLKipzmcUQbvwy5
Search warehouses for rent across the USA and book a tour or reserve warehouse space today, just visit www.warehouseexchange.com.
If you would like to talk about the property give us a call at (424) 239-2738
No part of this information may be copied, reproduced, repurposed, or screen-captured for any commercial purpose without prior written authorization from MyEListing.
While we strive to provide the most accurate information, all listing information, and demographic data, is provided by third-parties. As such, MyEListing will not be responsible for the accuracy of the information. It is strongly recommended that you verify all information with the listing agent, and any relevant agencies, prior to making any decisions.
What is the building size of this commercial Industrial property?
The size of this lease property at '.1 Marconi.' is 6720 square feet
What kind of Industrial is the propery at 1 Marconi?
The property at 1 Marconi Irvine, CA 92618 is listed as a Warehouse Industrial property
What is the population within 1 mile of 1 Marconi in Irvine?
The population within 1 mile of 1 Marconi Irvine, CA 92618 is 7,292 people.
Who do I contact for questions about 1 Marconi?
You should contact the listing agent,
Warehouse Exchange, for any details regarding this commercial listing.