Industrial Properties
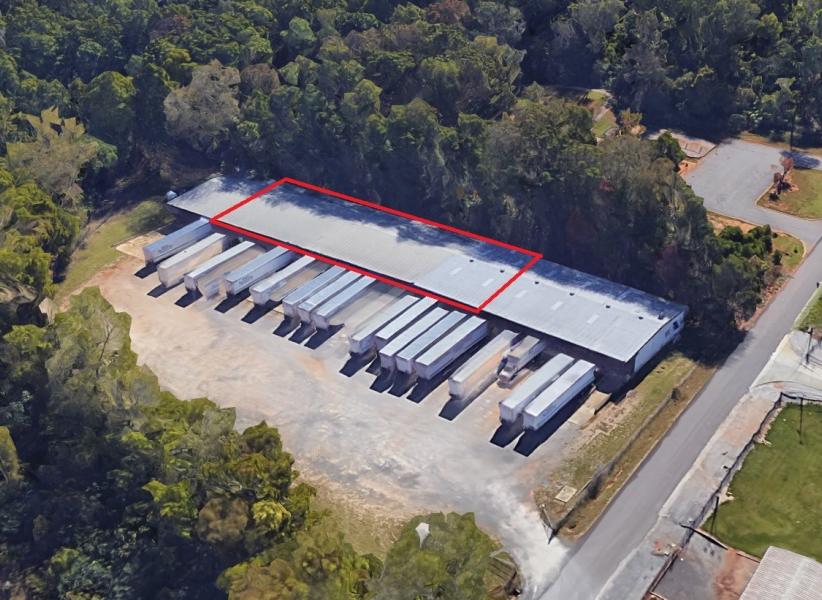
2421 Nabors Road Southwest Birmingham, AL 35211
2421 Nabors Road Southwest Birmingham, AL 35211
Details & Description
Property Highlights
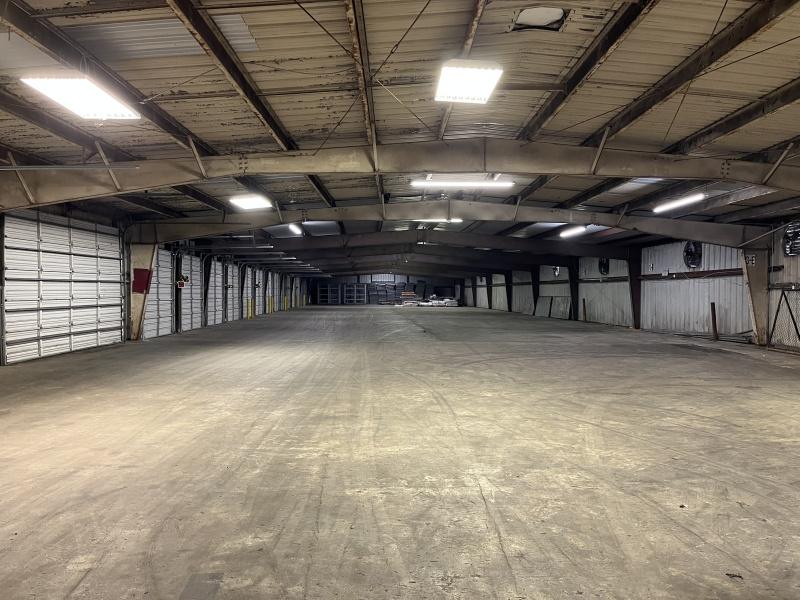
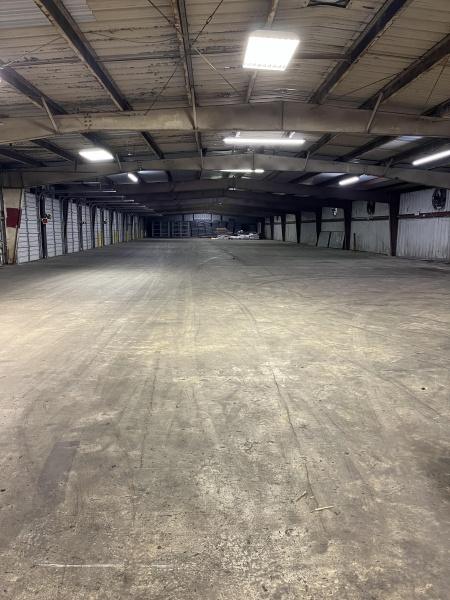
- • Suitable primarily for storage use
- • Ceiling Height – 9’-12’
- • 5 loading docks
Additional Photos


Listing Agents

Bill Warren
O: 205-960-1787
bwarren@lahcommercial.com
O: 205-960-1787
bwarren@lahcommercial.com
While we strive to provide the most accurate information, all listing information, and demographic data, is provided by third-parties. As such, MyEListing will not be responsible for the accuracy of the information. It is strongly recommended that you verify all information with the listing agent, and any relevant agencies, prior to making any decisions.


