Multifamily Housing
2134 Lynngate Drive Hoover, AL 35216
2134 Lynngate Drive Hoover, AL 35216

Details & Description
Property Highlights
• Strong rents in place in a highly desirable section of Birmingham’s most populated submarket
• Current rents are at $2,250 per unit, a year; room to grow these to about $2,500 (+)
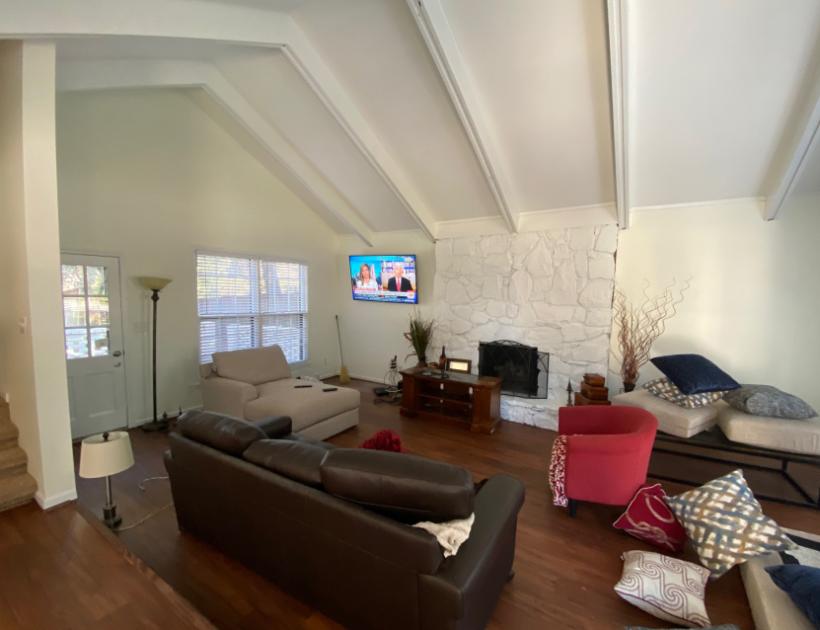
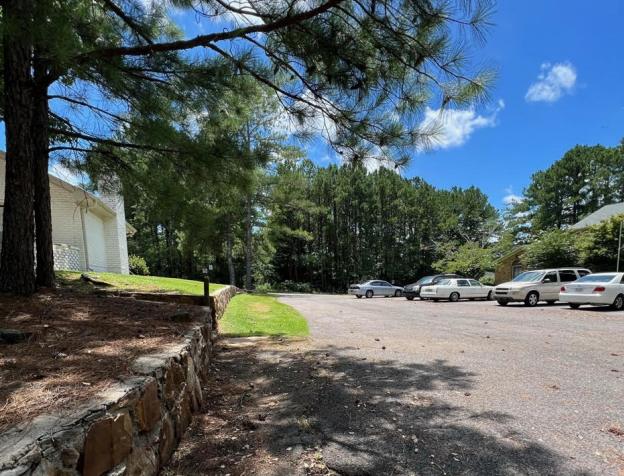
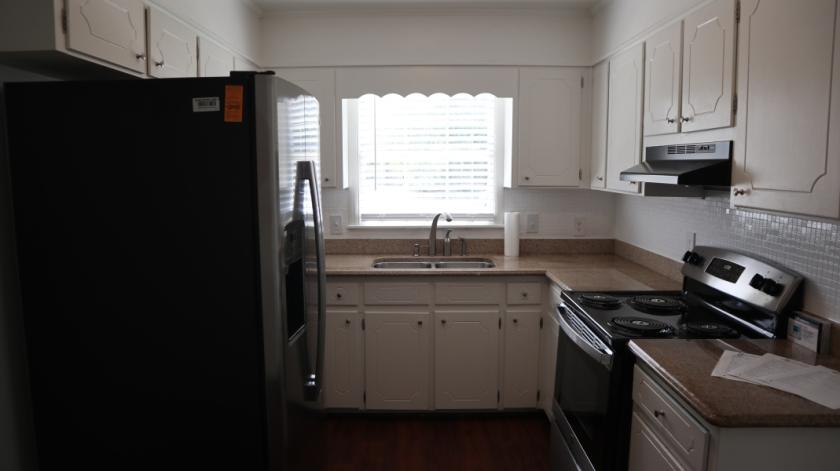
Additional Photos


Listing Agents

Alex Kyriazis
O: 251-591-9390
alexk@lahcommercial.com
O: 251-591-9390
alexk@lahcommercial.com
While we strive to provide the most accurate information, all listing information, and demographic data, is provided by third-parties. As such, MyEListing will not be responsible for the accuracy of the information. It is strongly recommended that you verify all information with the listing agent, and any relevant agencies, prior to making any decisions.