Office Space
2936 Marti Lane Montgomery, AL 36116
2936 Marti Lane Montgomery, AL 36116

Details & Description
Property Highlights
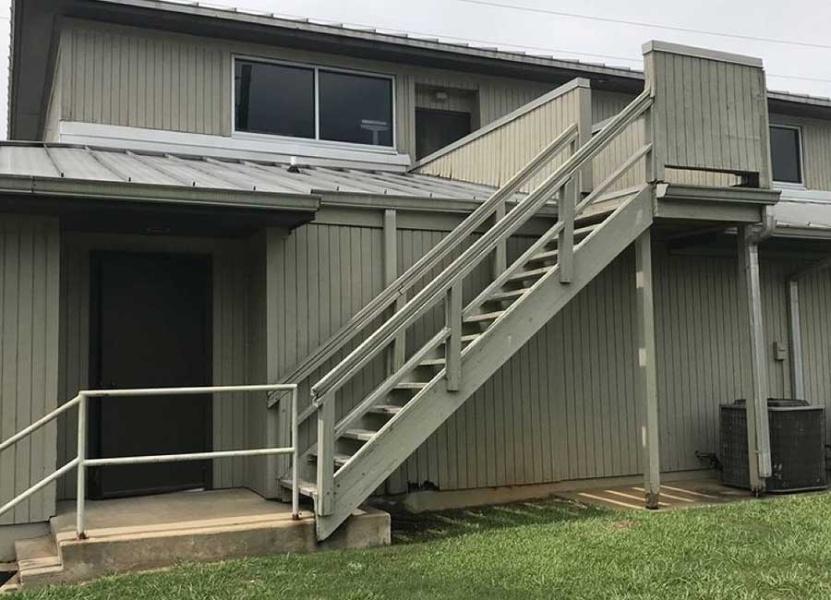
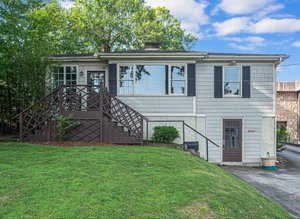
• This property is well suited for Investment as well as Owner/User, medical, dental or professional office
• Easy accessibility and great visibility from South BLVD (42,474 VPD)
Listing Agents

Rachel Nichols
O: 205-910-6080
rachel@lahcommercial.com
O: 205-910-6080
rachel@lahcommercial.com
While we strive to provide the most accurate information, all listing information, and demographic data, is provided by third-parties. As such, MyEListing will not be responsible for the accuracy of the information. It is strongly recommended that you verify all information with the listing agent, and any relevant agencies, prior to making any decisions.