Commercial Land
Springville Station Rd Springville, AL 35146
Springville Station Rd Springville, AL 35146
Details & Description
Property Highlights
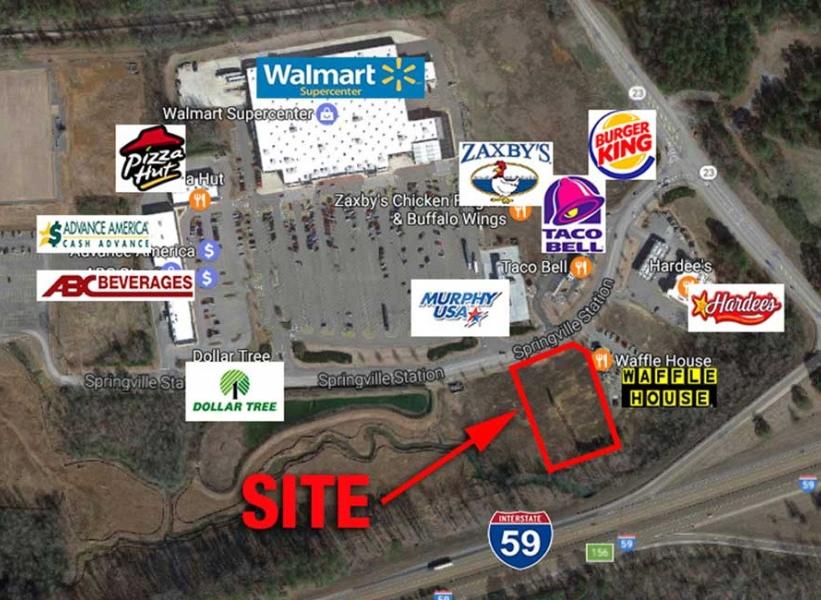
• Good location for restaurant, medical, car wash, hospitality and other uses
• Parcel located next to Waffle House and across from Murphy USA gas station
Listing Agents

Austin Blair
O: 205-478-7805
ablair@lahcommercial.com
O: 205-478-7805
ablair@lahcommercial.com
While we strive to provide the most accurate information, all listing information, and demographic data, is provided by third-parties. As such, MyEListing will not be responsible for the accuracy of the information. It is strongly recommended that you verify all information with the listing agent, and any relevant agencies, prior to making any decisions.


