Office Space
1519 Decatur Street Queens, NY 11385
1519 Decatur Street Queens, NY 11385

Details & Description
Property Highlights
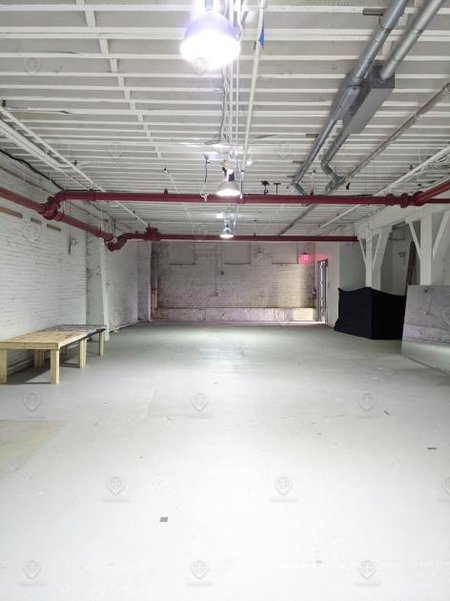
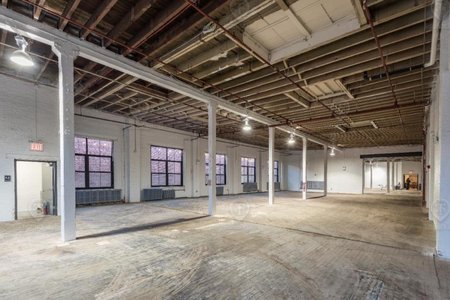
- • -High ceilings
- • -Tons of natural light
- • -Can be combined
- • -Pre-built offices and retail space
- • -Lower Level - Suite 108A - Office 200SF
Additional Photos


Listing Agents

Shlomi Bagdadi
O: 718-437-6100
info@tristatecr.com
O: 718-437-6100
info@tristatecr.com
While we strive to provide the most accurate information, all listing information, and demographic data, is provided by third-parties. As such, MyEListing will not be responsible for the accuracy of the information. It is strongly recommended that you verify all information with the listing agent, and any relevant agencies, prior to making any decisions.