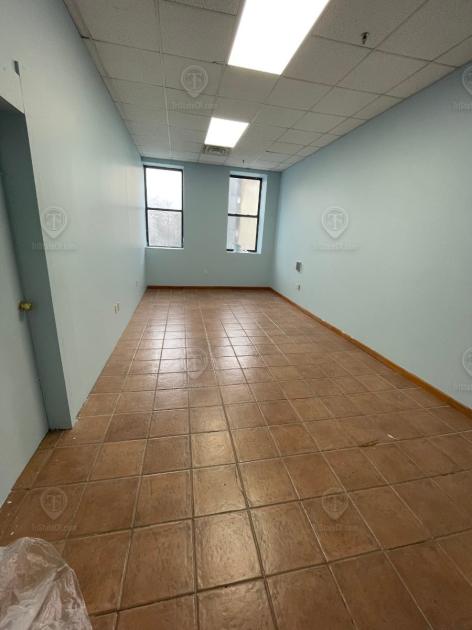
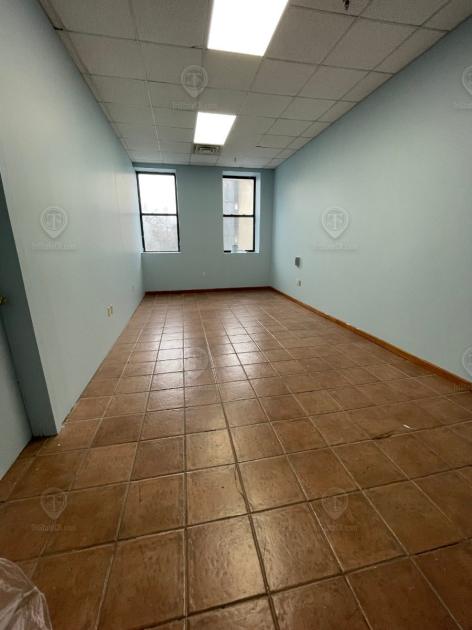
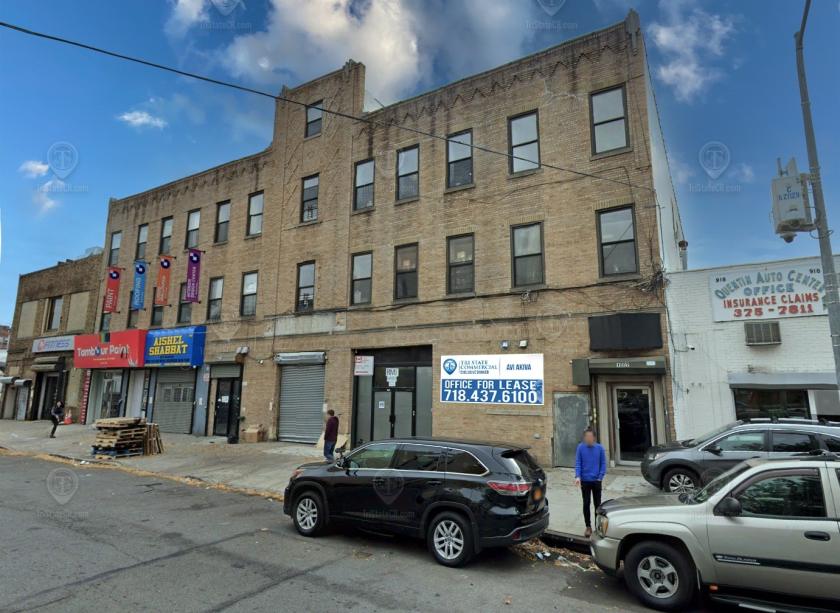
1-Mile | 3-Miles | 5-Miles | ||
---|---|---|---|---|
Total Population | 137,655 | 939,078 | 1,681,513 | |
Population Median Age | 38 | 39 | 39 | |
Population by Age | 0-9 Yrs | 22423 (16%) | 135252 (14%) | 224613 (13%) |
10-19 Yrs | 17006 (12%) | 115956 (12%) | 194036 (11%) | |
20-29 Yrs | 16737 (12%) | 119858 (12%) | 231531 (13%) | |
30-39 Yrs | 18195 (13%) | 125761 (13%) | 249296 (14%) | |
40-49 Yrs | 15765 (11%) | 111865 (11%) | 211073 (12%) | |
50-59 Yrs | 15953 (11%) | 113609 (12%) | 206385 (12%) | |
60-69 Yrs | 15645 (11%) | 109069 (11%) | 186029 (11%) | |
70+ Yrs | 15931 (11%) | 107708 (11%) | 178550 (10%) | |
Median HH Income | $62,239 | $60,713 | $64,020 | |
Total Household Income | < 24K | 11843 (24%) | 76344 (23%) | 138002 (22%) |
25-49K | 9292 (19%) | 65879 (19%) | 118035 (19%) | |
50-74K | 6980 (14%) | 50884 (15%) | 91508 (14%) | |
75-99K | 5309 (10%) | 38895 (11%) | 72792 (11%) | |
100-199K | 10849 (22%) | 73444 (22%) | 141413 (22%) | |
200K+ | 4392 (9%) | 26371 (7%) | 57837 (9%) | |
Highest Education Level | No Diploma | 15160 | 112408 | 200476 |
Diploma or GED | 22997 | 171713 | 298363 | |
Some College | 10432 | 79398 | 154278 | |
Assoc. Degree | 6424 | 44394 | 76564 | |
Bachelors Degree | 21385 | 136282 | 257181 | |
Higher Degree | 14379 | 89980 | 180488 | |
Total Housing Units | 52,877 | 358,069 | 672,942 | |
--Owner-Occupied | 17,826 | 129,930 | 217,523 | |
--Renter-Occupied | 30,840 | 201,886 | 402,064 | |
Owner-Occupied Values | < 100K | 488 | 3826 | 6869 |
100-199K | 511 | 5213 | 7151 | |
200-299K | 1195 | 7718 | 10650 | |
300-399K | 833 | 7877 | 14678 | |
400-499K | 561 | 10800 | 20192 | |
500K+ | 14237 | 94495 | 157983 | |
Total Working Age Population | 104,293 | 729,760 | 1,333,527 | |
In Work Force | 62,192 | 437,918 | 831,710 | |
Not In Work Force | 42,100 | 291,842 | 501,817 | |
Workforce Employed | 58,858 | 411,675 | 780,062 | |
Workforce Unemployed | 3,307 | 25,988 | 51,047 | |
Civlian Workforce | 62,164 | 437,662 | 831,109 | |
Military Workforce | 28 | 255 | 601 | |
Total Households | 48,666 | 331,816 | 619,587 | |
Family Households | 34,149 | 232,383 | 404,694 | |
Non-Family Households | 14,517 | 99,433 | 214,892 | |
Married Couple | 26,096 | 162,995 | 263,585 | |
Other Family | 8,053 | 69,388 | 141,110 | |
Married w/Child | 12,278 | 73,366 | 116,136 | |
Single Male w/Child | 707 | 4,959 | 9,778 | |
Single Female w/Child | 2,240 | 18,881 | 40,875 |
Population Change Last Two Decades - Plus Projection
2000 | % | 2010 | % | 2020 | % | 2030 | |
---|---|---|---|---|---|---|---|
New York | 18,976,457 | +2 | 19,378,102 | +4 | 20,146,131 | +2 | 20,604,030 |
Queens County | 2,229,379 | 0 | 2,230,722 | +9 | 2,436,549 | +5 | 2,565,268 |
Richmond County | 443,728 | +6 | 468,730 | +3 | 481,351 | +1 | 488,119 |
Kings County | 2,465,326 | +2 | 2,504,700 | +9 | 2,738,283 | +5 | 2,863,996 |
Total Working Age Population:
Total Households:
Total Working Age Population:
Total Households:
Total Working Age Population:
Total Households: