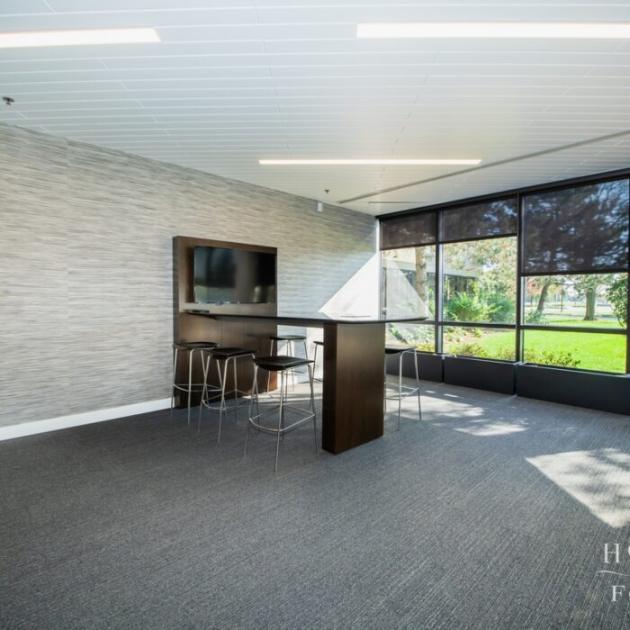
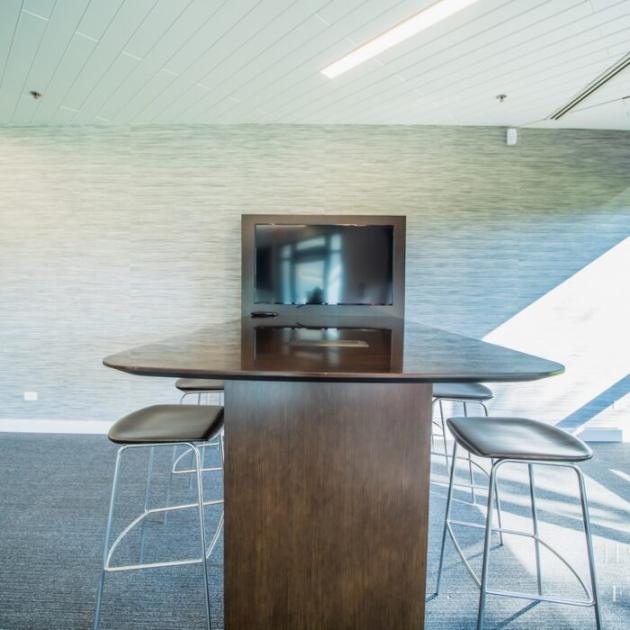
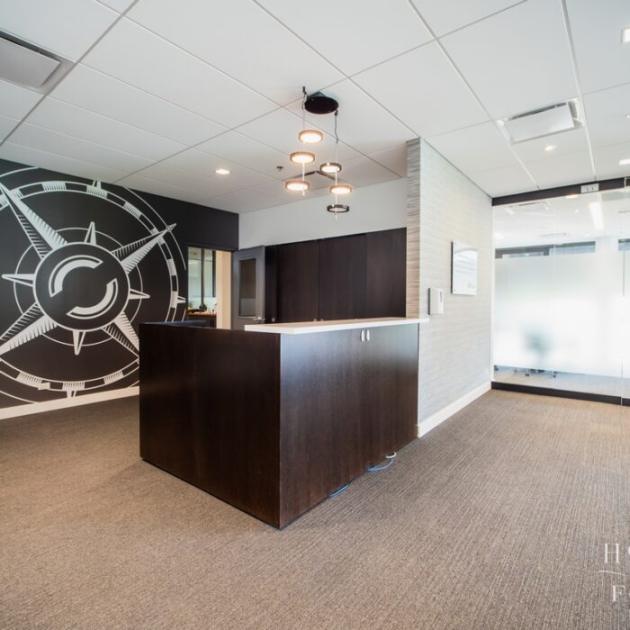
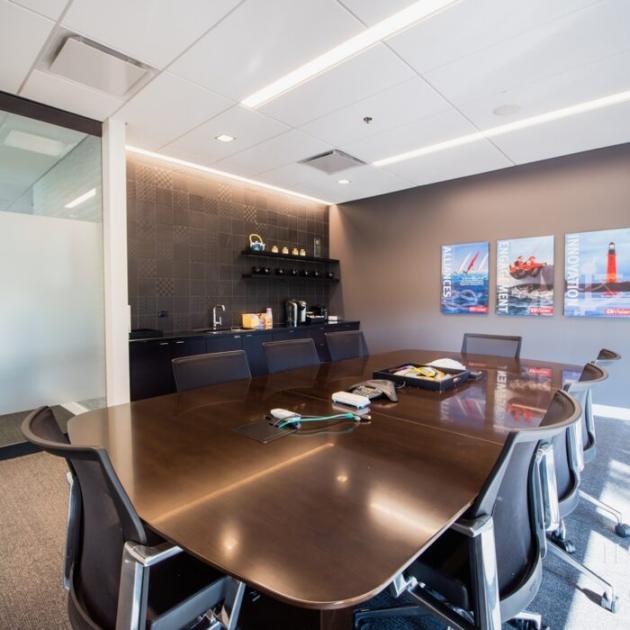
Office Space
150 East Dartmoor Drive Crystal Lake, IL 60014
150 East Dartmoor Drive Crystal Lake, IL 60014
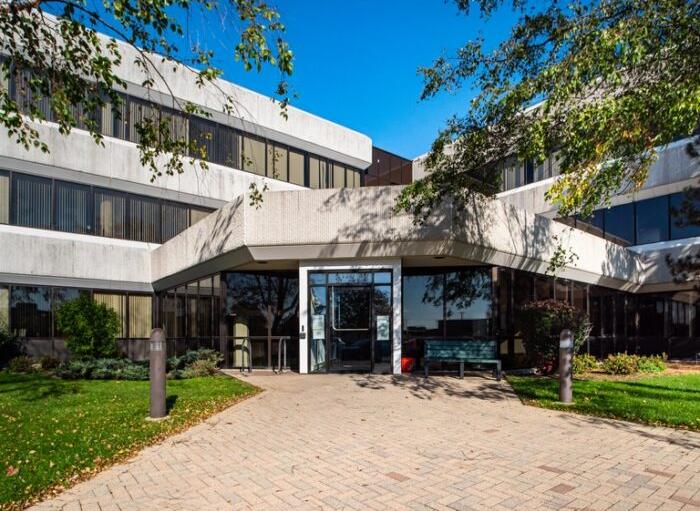
Details & Description
Property Highlights
- • Year Built 1991 Renovation 2016-2018
- • HVAC System Gas Hot Water / Central Air
- • Electric 1200 Amp, 480V
- • Washrooms 7 ADA
- • Ceiling Height 9’
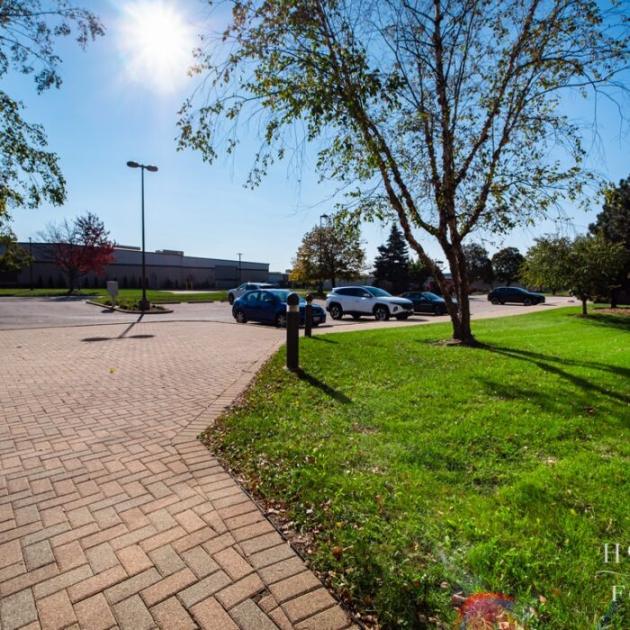
- • Parking 82
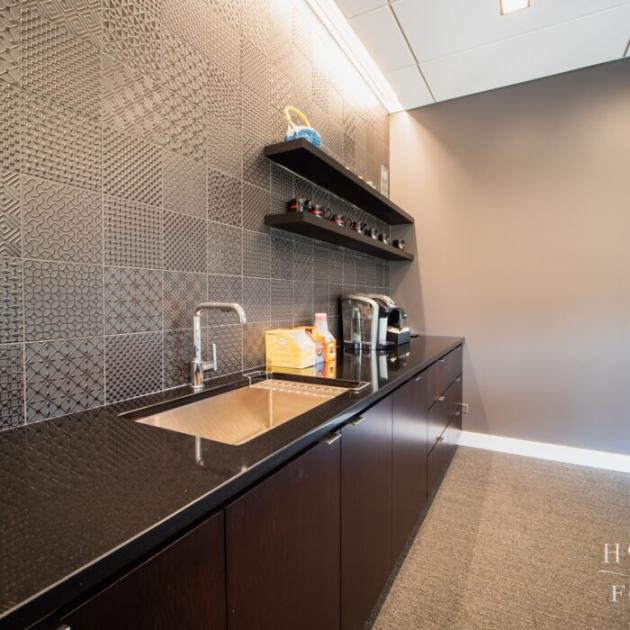
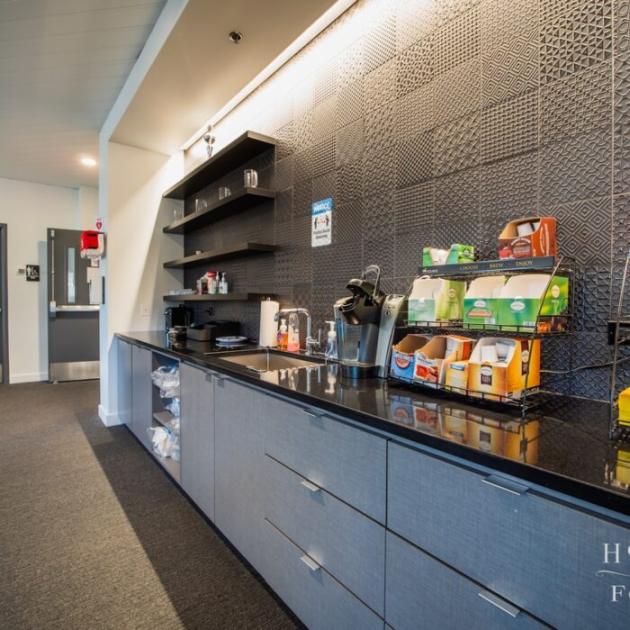
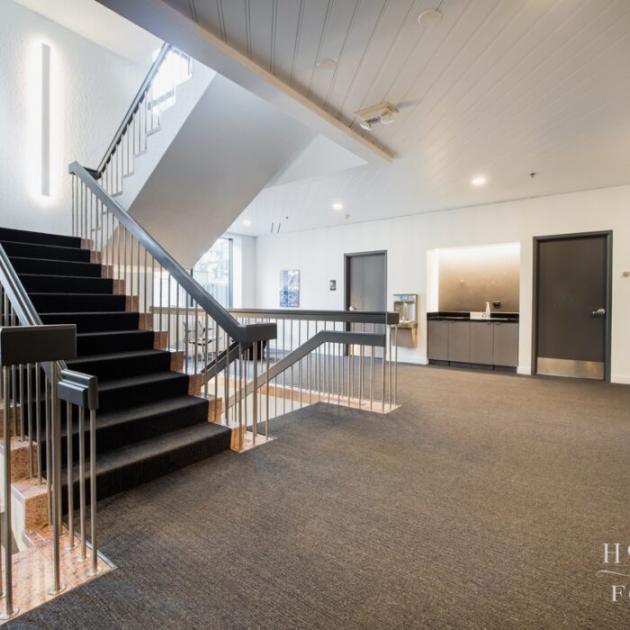
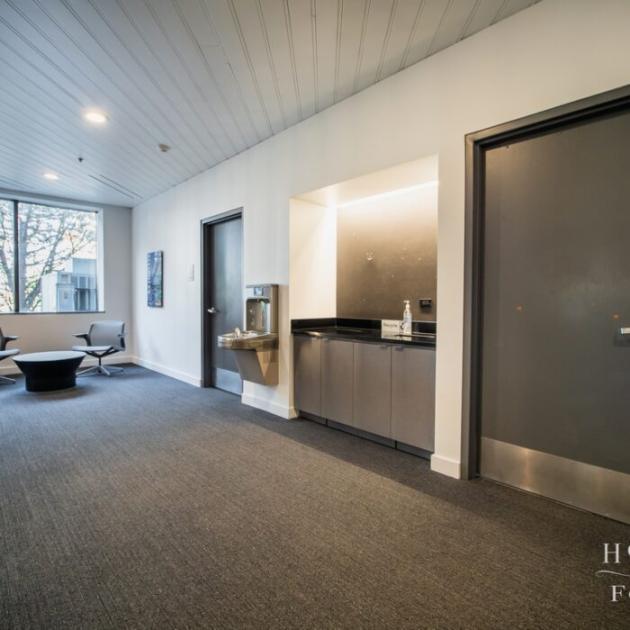
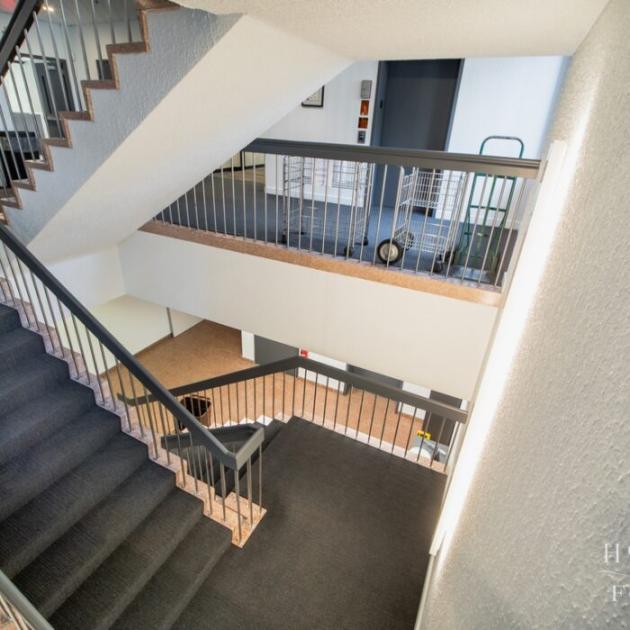
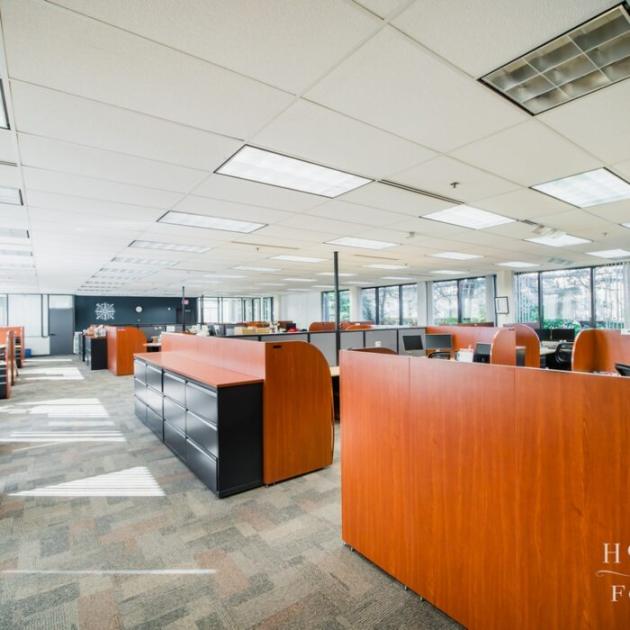
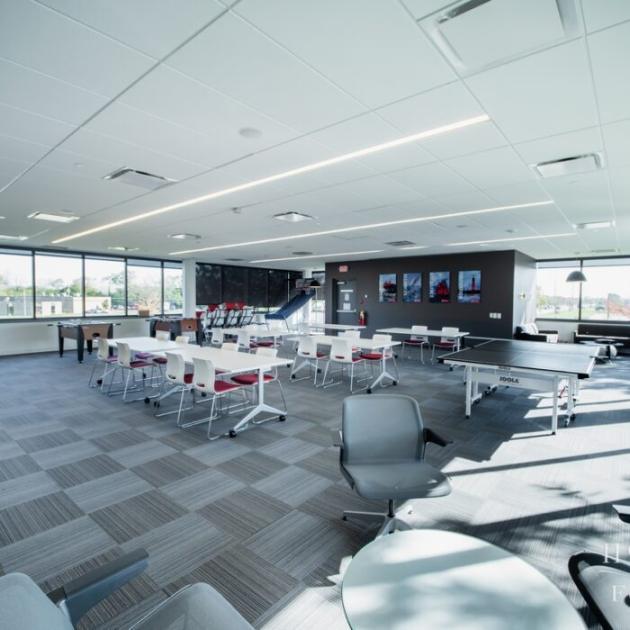
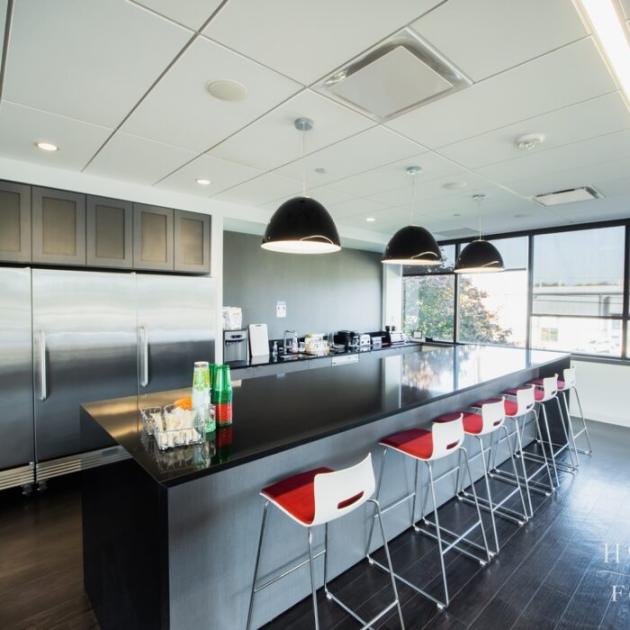
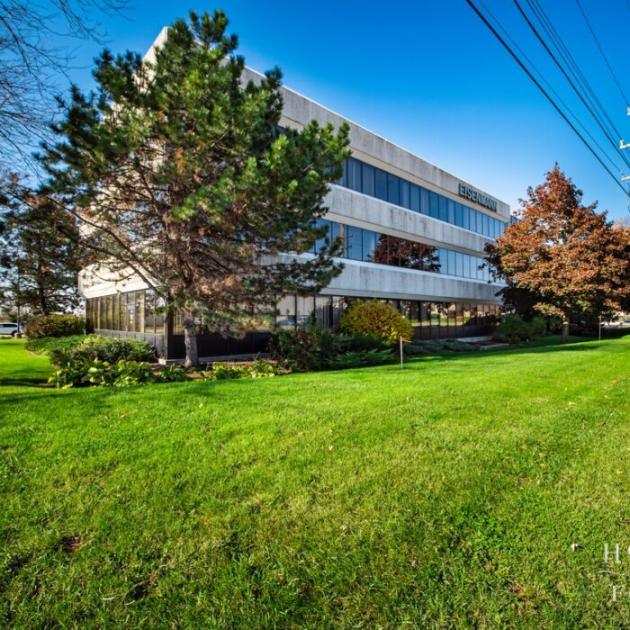
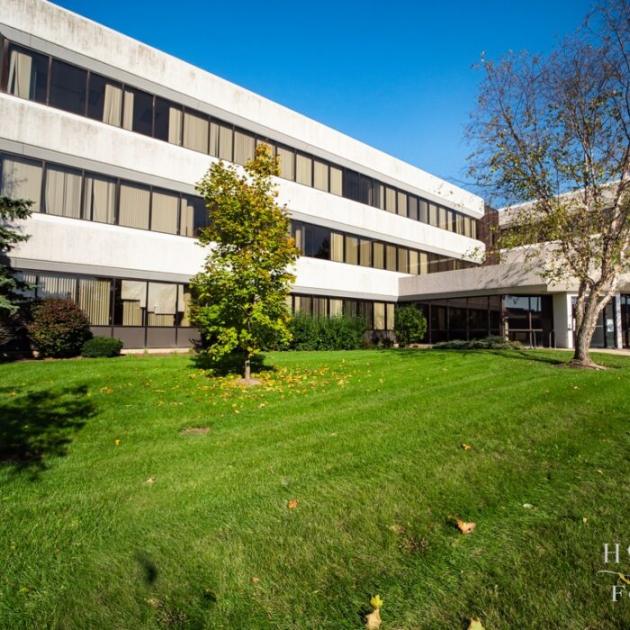
Additional Photos

Listing Agents

Bruce Kaplan
O: 847-854-2300
M: 847-507-1759
brucek@premiercommercialrealty.com
O: 847-854-2300
M: 847-507-1759
brucek@premiercommercialrealty.com

Kevin Kaplan
O: 847-854-2300
M: 309-261-0920
kevink@premiercommercialrealty.com
O: 847-854-2300
M: 309-261-0920
kevink@premiercommercialrealty.com
While we strive to provide the most accurate information, all listing information, and demographic data, is provided by third-parties. As such, MyEListing will not be responsible for the accuracy of the information. It is strongly recommended that you verify all information with the listing agent, and any relevant agencies, prior to making any decisions.