Commercial Land
0 E Terra Cotta Ave Crystal Lake, IL 60012
0 E Terra Cotta Ave Crystal Lake, IL 60012

Details & Description
Property Highlights
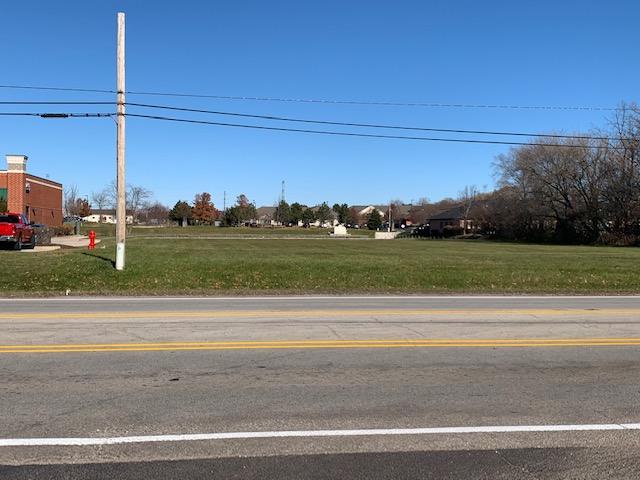
- • Topography Level
- • Environmental Status Clean
- • Utilities To Site
- • Sewer/Water City
- • Frontage Dimensions 180’
- • Zoning B-2 PUD
Listing Agents

Mike Deacon
O: 847-854-2300
M: 815-814-6500
michaeld@premiercommercialrealty.com
O: 847-854-2300
M: 815-814-6500
michaeld@premiercommercialrealty.com
While we strive to provide the most accurate information, all listing information, and demographic data, is provided by third-parties. As such, MyEListing will not be responsible for the accuracy of the information. It is strongly recommended that you verify all information with the listing agent, and any relevant agencies, prior to making any decisions.