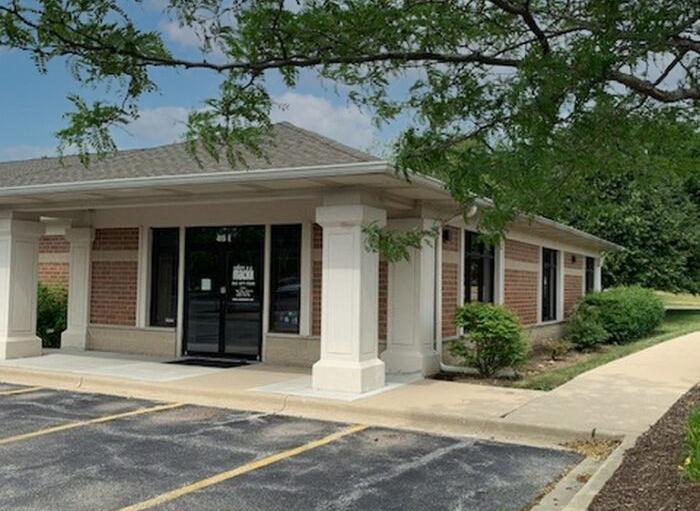
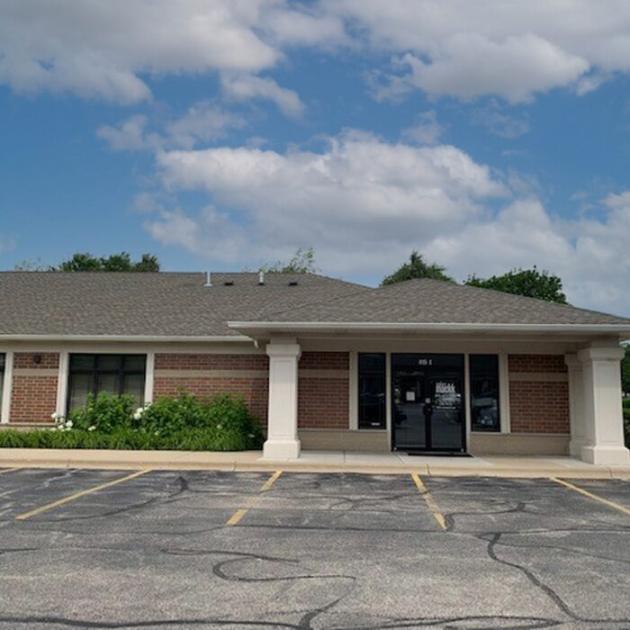
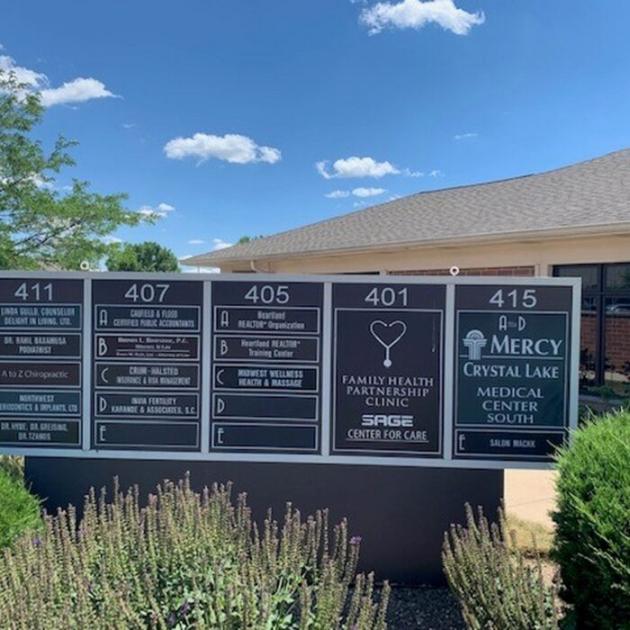
1-Mile | 3-Miles | 5-Miles | ||
---|---|---|---|---|
Total Population | 3,895 | 46,410 | 118,660 | |
Population Median Age | 40 | 39 | 39 | |
Population by Age | 0-9 Yrs | 512 (13%) | 5363 (11%) | 13806 (11%) |
10-19 Yrs | 560 (14%) | 6501 (14%) | 16829 (14%) | |
20-29 Yrs | 317 (8%) | 5002 (10%) | 13151 (11%) | |
30-39 Yrs | 437 (11%) | 6016 (12%) | 14718 (12%) | |
40-49 Yrs | 623 (15%) | 6149 (13%) | 16361 (13%) | |
50-59 Yrs | 577 (14%) | 7269 (15%) | 19907 (16%) | |
60-69 Yrs | 476 (12%) | 5768 (12%) | 13981 (11%) | |
70+ Yrs | 392 (10%) | 4342 (9%) | 9906 (8%) | |
Median HH Income | $85,603 | $89,121 | $97,328 | |
Total Household Income | < 24K | 175 (11%) | 1393 (8%) | 3069 (7%) |
25-49K | 293 (19%) | 3024 (17%) | 6465 (14%) | |
50-74K | 178 (12%) | 2569 (14%) | 6544 (15%) | |
75-99K | 218 (14%) | 2878 (16%) | 6142 (14%) | |
100-199K | 493 (33%) | 5850 (33%) | 15477 (35%) | |
200K+ | 120 (8%) | 1509 (8%) | 5432 (12%) | |
Highest Education Level | No Diploma | 309 | 2050 | 4353 |
Diploma or GED | 347 | 6807 | 17160 | |
Some College | 596 | 7591 | 18510 | |
Assoc. Degree | 249 | 3033 | 7778 | |
Bachelors Degree | 759 | 7914 | 21517 | |
Higher Degree | 377 | 4519 | 11504 | |
Total Housing Units | 1,537 | 18,049 | 45,003 | |
--Owner-Occupied | 1,033 | 13,449 | 35,497 | |
--Renter-Occupied | 444 | 3,775 | 7,632 | |
Owner-Occupied Values | < 100K | 113 | 1058 | 1652 |
100-199K | 257 | 3710 | 9494 | |
200-299K | 372 | 5550 | 14330 | |
300-399K | 254 | 2243 | 6271 | |
400-499K | 30 | 566 | 2306 | |
500K+ | 7 | 322 | 1443 | |
Total Working Age Population | 3,061 | 36,881 | 94,666 | |
In Work Force | 2,170 | 26,443 | 68,604 | |
Not In Work Force | 891 | 10,438 | 26,062 | |
Workforce Employed | 1,977 | 25,341 | 65,436 | |
Workforce Unemployed | 193 | 1,101 | 3,152 | |
Civlian Workforce | 2,170 | 26,442 | 68,588 | |
Military Workforce | 0 | 1 | 16 | |
Total Households | 1,477 | 17,224 | 43,129 | |
Family Households | 1,124 | 13,069 | 33,024 | |
Non-Family Households | 353 | 4,155 | 10,105 | |
Married Couple | 879 | 10,579 | 27,287 | |
Other Family | 245 | 2,491 | 5,737 | |
Married w/Child | 387 | 4,202 | 11,512 | |
Single Male w/Child | 25 | 406 | 917 | |
Single Female w/Child | 85 | 907 | 2,126 |
Population Change Last Two Decades - Plus Projection
2000 | % | 2010 | % | 2020 | % | 2030 | |
---|---|---|---|---|---|---|---|
Illinois | 12,419,293 | +3 | 12,830,632 | +12 | 14,316,487 | +6 | 15,138,849 |
McHenry County | 260,077 | +19 | 308,760 | +32 | 407,931 | +9 | 443,398 |
Total Working Age Population:
Total Households:
Total Working Age Population:
Total Households:
Total Working Age Population:
Total Households: