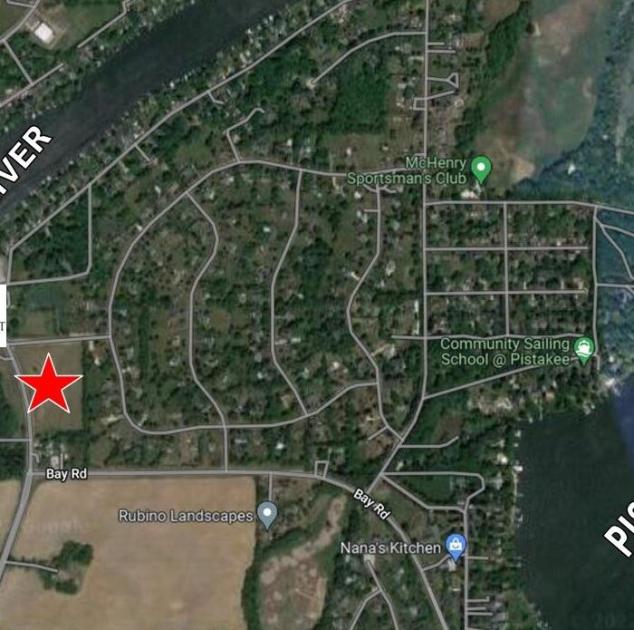
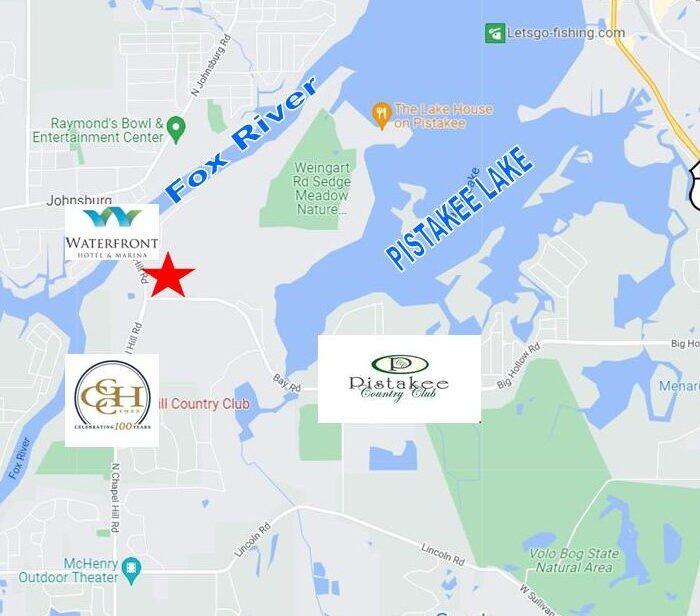
1-Mile | 3-Miles | 5-Miles | ||
---|---|---|---|---|
Total Population | 2,746 | 25,602 | 66,304 | |
Population Median Age | 42 | 41 | 40 | |
Population by Age | 0-9 Yrs | 219 (7%) | 2235 (8%) | 7002 (10%) |
10-19 Yrs | 499 (18%) | 3643 (14%) | 8783 (13%) | |
20-29 Yrs | 188 (6%) | 3060 (11%) | 8356 (12%) | |
30-39 Yrs | 310 (11%) | 2814 (10%) | 7560 (11%) | |
40-49 Yrs | 327 (11%) | 3222 (12%) | 8614 (12%) | |
50-59 Yrs | 535 (19%) | 5210 (20%) | 12100 (18%) | |
60-69 Yrs | 353 (12%) | 3157 (12%) | 7764 (11%) | |
70+ Yrs | 314 (11%) | 2261 (8%) | 6125 (9%) | |
Median HH Income | $93,795 | $82,702 | $76,505 | |
Total Household Income | < 24K | 140 (13%) | 1250 (12%) | 3298 (12%) |
25-49K | 126 (11%) | 1612 (15%) | 4634 (17%) | |
50-74K | 161 (15%) | 1783 (17%) | 4826 (18%) | |
75-99K | 137 (12%) | 1397 (13%) | 3417 (13%) | |
100-199K | 379 (35%) | 3180 (31%) | 7668 (29%) | |
200K+ | 118 (11%) | 930 (9%) | 2085 (8%) | |
Highest Education Level | No Diploma | 113 | 1046 | 3393 |
Diploma or GED | 651 | 6325 | 15223 | |
Some College | 426 | 4114 | 10698 | |
Assoc. Degree | 135 | 1504 | 4073 | |
Bachelors Degree | 476 | 3878 | 9452 | |
Higher Degree | 136 | 1497 | 3855 | |
Total Housing Units | 1,181 | 11,088 | 27,753 | |
--Owner-Occupied | 957 | 8,004 | 19,955 | |
--Renter-Occupied | 104 | 2,147 | 5,973 | |
Owner-Occupied Values | < 100K | 32 | 532 | 1645 |
100-199K | 207 | 3281 | 9013 | |
200-299K | 378 | 2250 | 5425 | |
300-399K | 168 | 1038 | 2361 | |
400-499K | 85 | 572 | 918 | |
500K+ | 87 | 331 | 593 | |
Total Working Age Population | 2,197 | 21,167 | 53,694 | |
In Work Force | 1,395 | 14,823 | 37,421 | |
Not In Work Force | 801 | 6,344 | 16,273 | |
Workforce Employed | 1,306 | 14,213 | 35,653 | |
Workforce Unemployed | 90 | 602 | 1,723 | |
Civlian Workforce | 1,395 | 14,816 | 37,376 | |
Military Workforce | 0 | 7 | 45 | |
Total Households | 1,061 | 10,151 | 25,928 | |
Family Households | 771 | 6,979 | 17,099 | |
Non-Family Households | 290 | 3,172 | 8,829 | |
Married Couple | 629 | 5,577 | 13,721 | |
Other Family | 142 | 1,403 | 3,378 | |
Married w/Child | 282 | 1,986 | 5,094 | |
Single Male w/Child | 12 | 251 | 601 | |
Single Female w/Child | 57 | 523 | 1,244 |
Population Change Last Two Decades - Plus Projection
2000 | % | 2010 | % | 2020 | % | 2030 | |
---|---|---|---|---|---|---|---|
Illinois | 12,419,293 | +3 | 12,830,632 | +12 | 14,316,487 | +6 | 15,138,849 |
Lake County | 644,356 | +9 | 703,462 | +17 | 820,250 | +6 | 873,024 |
McHenry County | 260,077 | +19 | 308,760 | +32 | 407,931 | +9 | 443,398 |
Total Working Age Population:
Total Households:
Total Working Age Population:
Total Households:
Total Working Age Population:
Total Households: