Industrial Properties
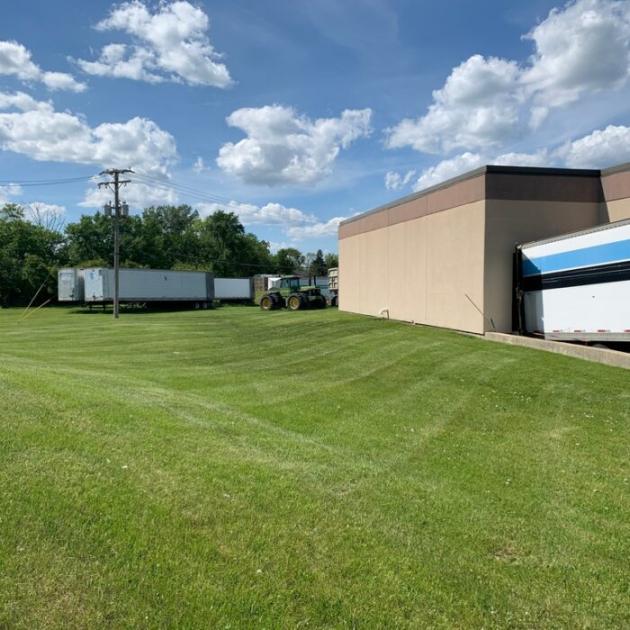
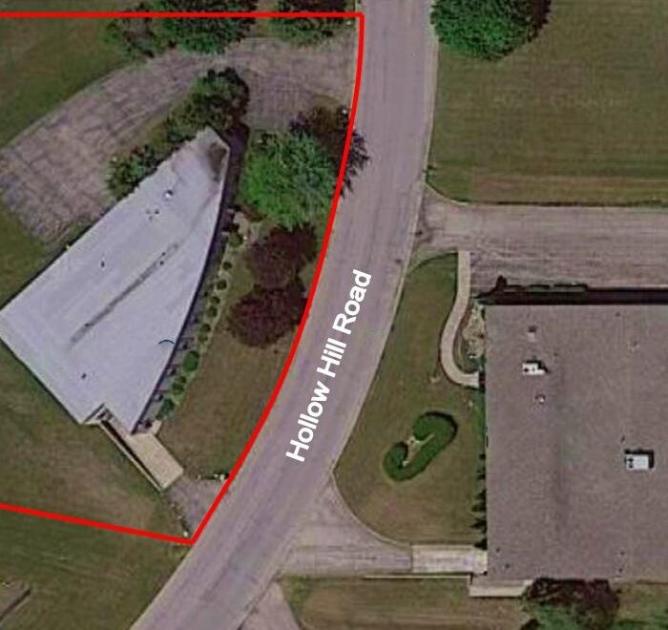
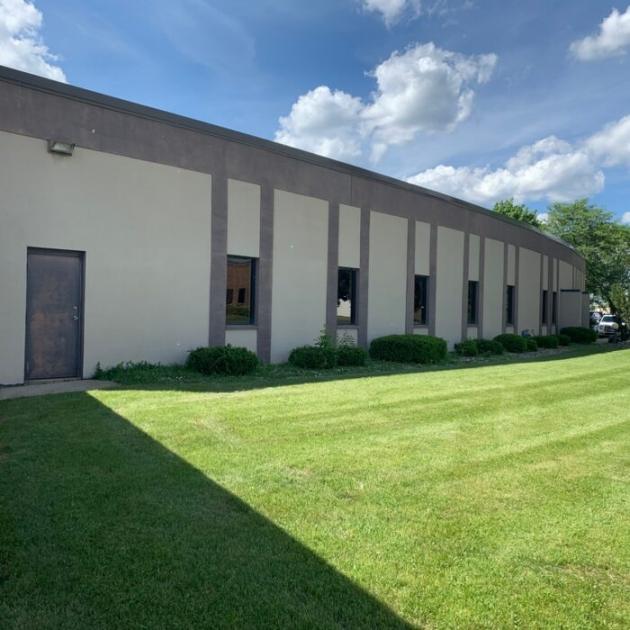
387 Hollow Hill Drive Wauconda, IL 60084
387 Hollow Hill Drive Wauconda, IL 60084
Details & Description
Property Highlights
- • Year Built 1988
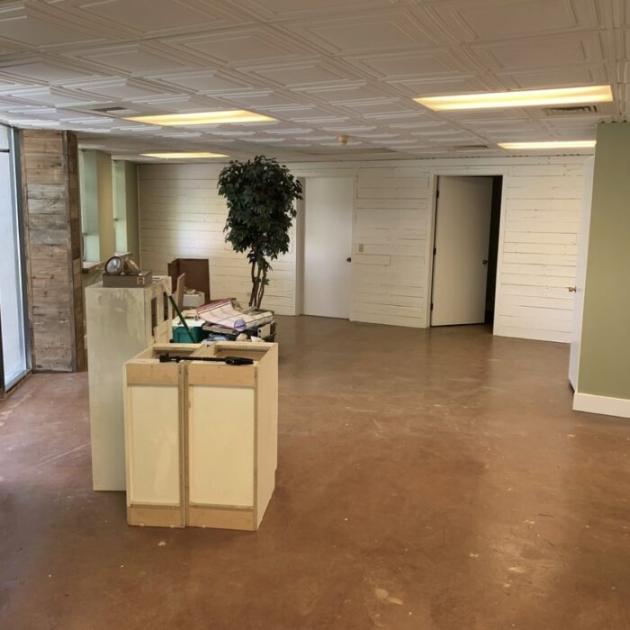
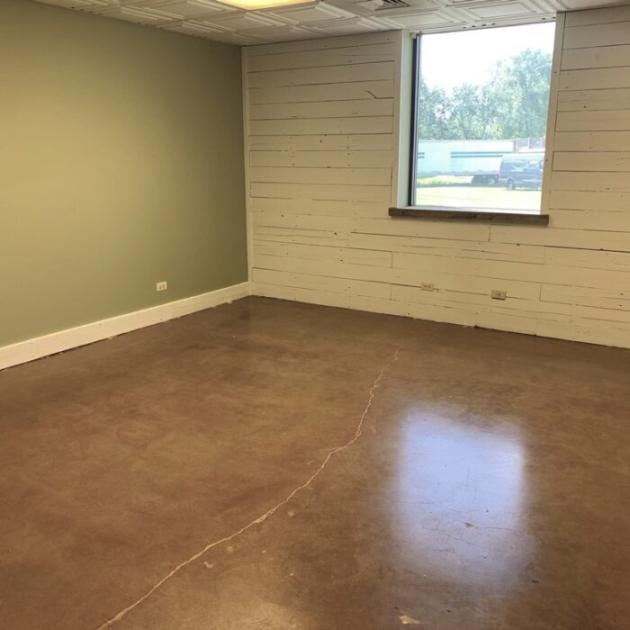
- • Office Size ±1,500 SF
- • HVAC System GFA / Central Air (office)
- • Electrical 800 AMP, 240V, 3 Phase
- • Sprinkled No
- • Washrooms 2 ADA
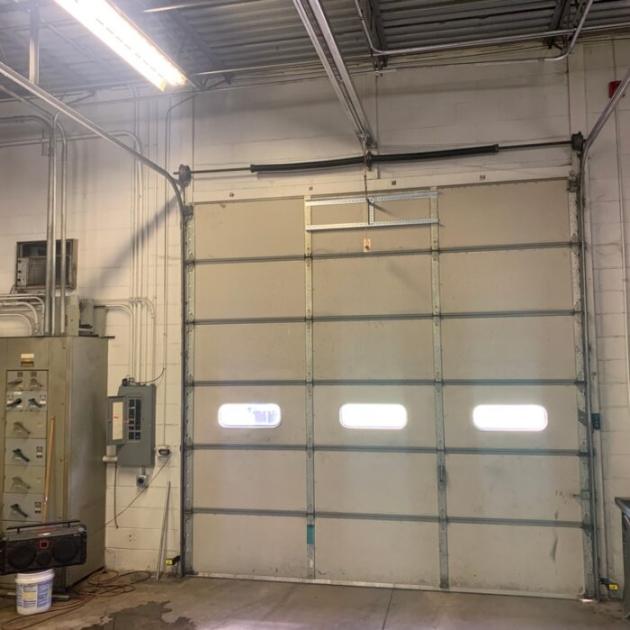
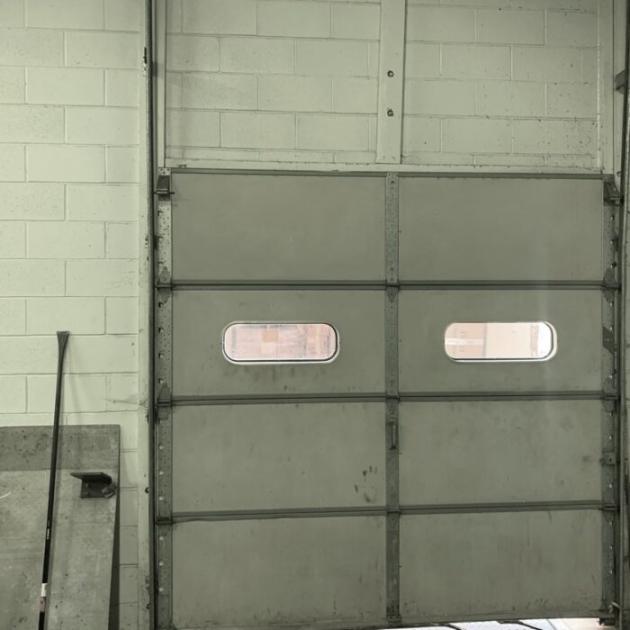
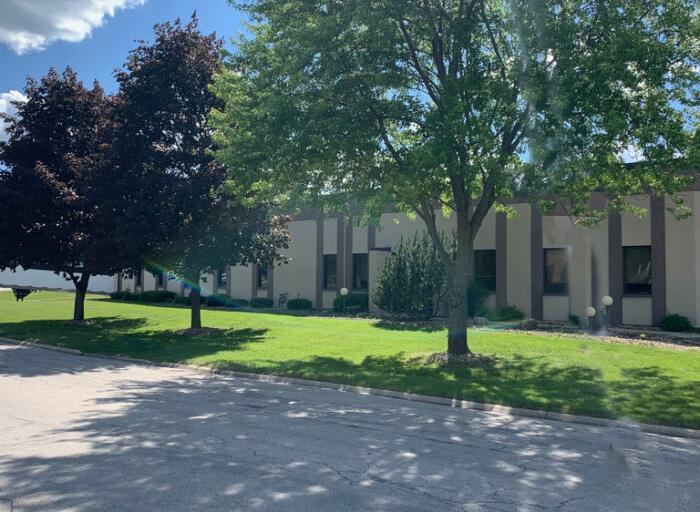
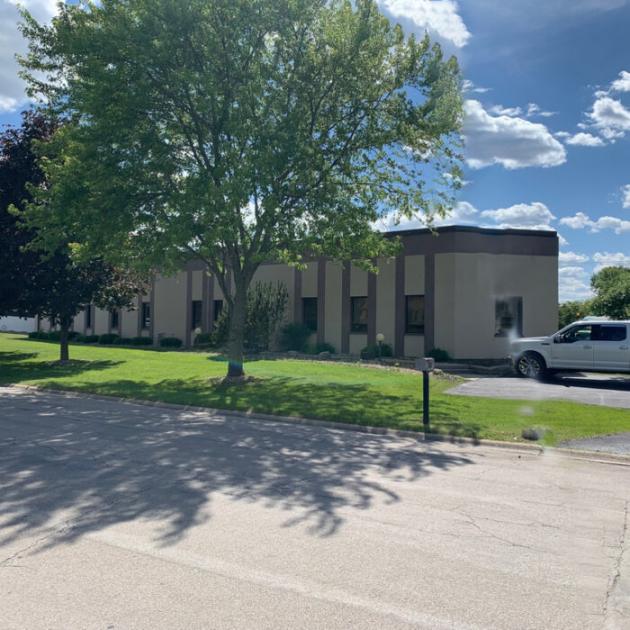
Additional Photos


Listing Agents

Kevin Kaplan
O: 847-854-2300
M: 309-261-0920
kevink@premiercommercialrealty.com
O: 847-854-2300
M: 309-261-0920
kevink@premiercommercialrealty.com

Bruce Kaplan
O: 847-854-2300
M: 847-507-1759
brucek@premiercommercialrealty.com
O: 847-854-2300
M: 847-507-1759
brucek@premiercommercialrealty.com
While we strive to provide the most accurate information, all listing information, and demographic data, is provided by third-parties. As such, MyEListing will not be responsible for the accuracy of the information. It is strongly recommended that you verify all information with the listing agent, and any relevant agencies, prior to making any decisions.