Commercial Land
14346 Interstate 10 Converse, TX 78109
14346 Interstate 10 Converse, TX 78109
Details & Description
Property Highlights
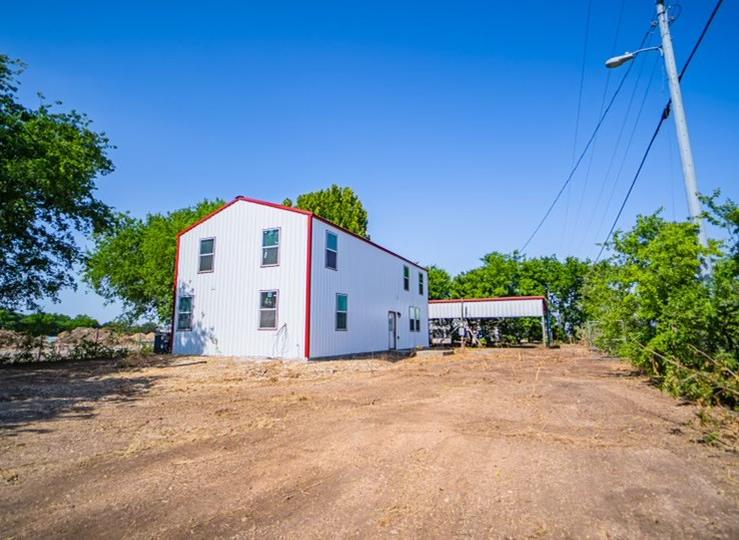
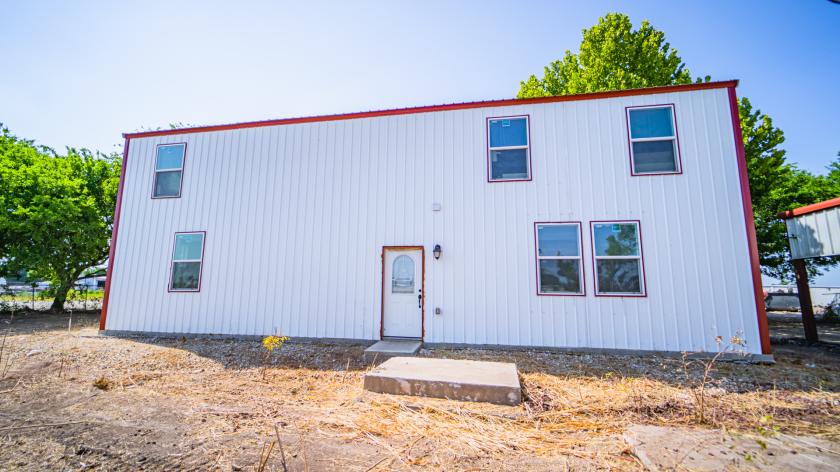
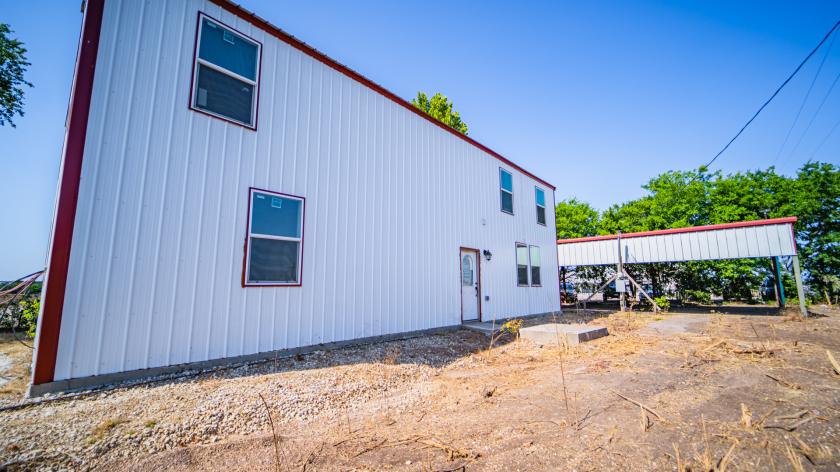
• BUILDING: ±1,200 SF under renovations (fenced)
• SCHOOL DISTRICT: Schertz, Cibolo, Universal City ISD
Additional Photos


Listing Agents

Walker Petty
O: 210-366-2222
M: 210-275-2812
wpetty@endurasa.com
O: 210-366-2222
M: 210-275-2812
wpetty@endurasa.com
While we strive to provide the most accurate information, all listing information, and demographic data, is provided by third-parties. As such, MyEListing will not be responsible for the accuracy of the information. It is strongly recommended that you verify all information with the listing agent, and any relevant agencies, prior to making any decisions.


