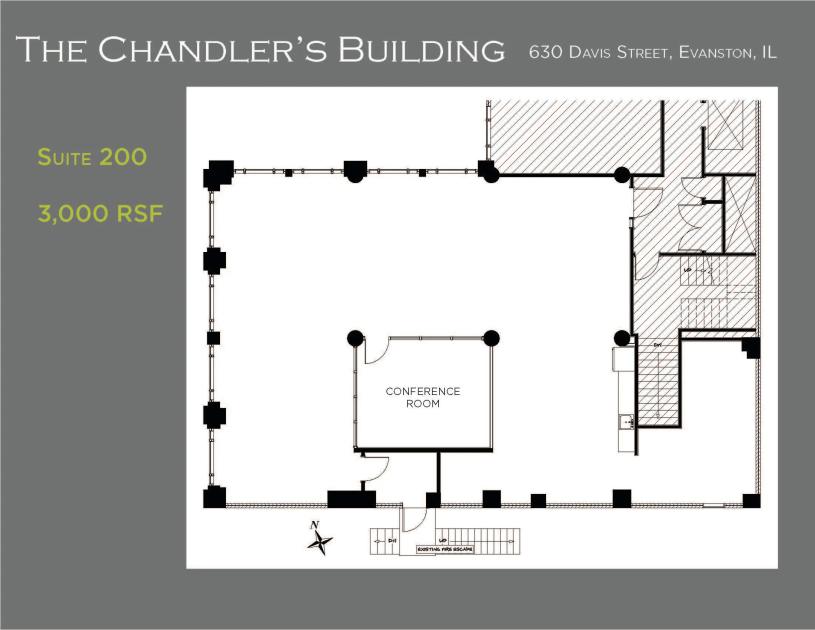
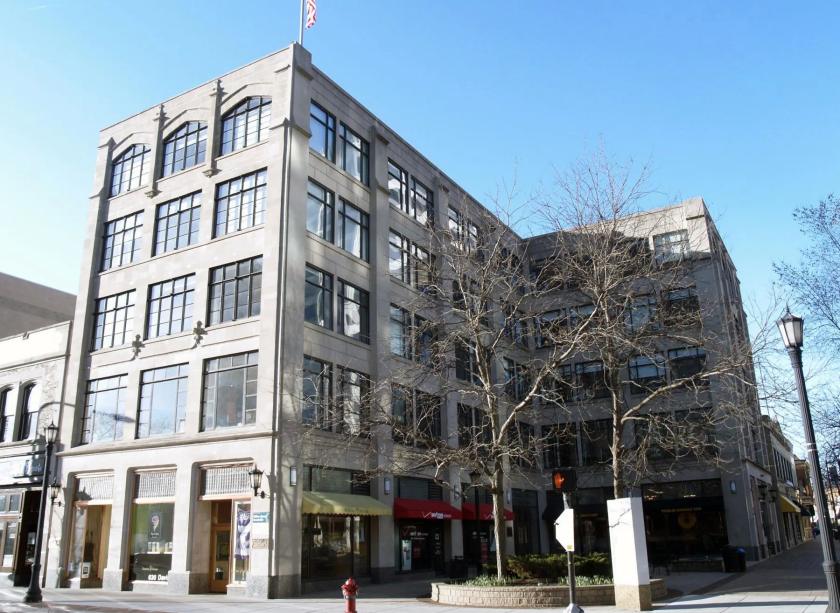
1-Mile | 3-Miles | 5-Miles | ||
---|---|---|---|---|
Total Population | 30,078 | 173,541 | 425,624 | |
Population Median Age | 36 | 39 | 39 | |
Population by Age | 0-9 Yrs | 2651 (8%) | 20909 (12%) | 51798 (12%) |
10-19 Yrs | 4349 (14%) | 22808 (13%) | 51512 (12%) | |
20-29 Yrs | 8771 (29%) | 24934 (14%) | 60072 (14%) | |
30-39 Yrs | 3053 (10%) | 21960 (12%) | 58785 (13%) | |
40-49 Yrs | 2946 (9%) | 23693 (13%) | 55912 (13%) | |
50-59 Yrs | 2588 (8%) | 22130 (12%) | 54880 (12%) | |
60-69 Yrs | 2772 (9%) | 19146 (11%) | 47913 (11%) | |
70+ Yrs | 2948 (9%) | 17959 (10%) | 44752 (10%) | |
Median HH Income | $67,118 | $73,618 | $69,367 | |
Total Household Income | < 24K | 2483 (21%) | 11600 (17%) | 29835 (18%) |
25-49K | 2203 (19%) | 12207 (18%) | 31929 (19%) | |
50-74K | 1444 (12%) | 10305 (15%) | 26416 (15%) | |
75-99K | 914 (8%) | 7435 (11%) | 17945 (10%) | |
100-199K | 2509 (22%) | 15408 (22%) | 38083 (23%) | |
200K+ | 1752 (15%) | 10198 (15%) | 20985 (12%) | |
Highest Education Level | No Diploma | 835 | 9982 | 28789 |
Diploma or GED | 1526 | 15742 | 44635 | |
Some College | 1846 | 15291 | 41541 | |
Assoc. Degree | 604 | 5823 | 15313 | |
Bachelors Degree | 5403 | 35089 | 89676 | |
Higher Degree | 6942 | 34952 | 73577 | |
Total Housing Units | 12,850 | 73,816 | 180,478 | |
--Owner-Occupied | 5,179 | 36,359 | 86,877 | |
--Renter-Occupied | 6,126 | 30,795 | 78,317 | |
Owner-Occupied Values | < 100K | 210 | 1450 | 4000 |
100-199K | 697 | 5569 | 13374 | |
200-299K | 935 | 6506 | 16775 | |
300-399K | 882 | 6607 | 17536 | |
400-499K | 484 | 4636 | 11232 | |
500K+ | 1971 | 11590 | 23961 | |
Total Working Age Population | 25,867 | 140,156 | 344,849 | |
In Work Force | 14,548 | 90,761 | 222,723 | |
Not In Work Force | 11,319 | 49,394 | 122,126 | |
Workforce Employed | 13,724 | 86,307 | 210,990 | |
Workforce Unemployed | 807 | 4,418 | 11,612 | |
Civlian Workforce | 14,531 | 90,724 | 222,602 | |
Military Workforce | 17 | 37 | 120 | |
Total Households | 11,305 | 67,154 | 165,194 | |
Family Households | 4,896 | 37,805 | 94,120 | |
Non-Family Households | 6,409 | 29,349 | 71,074 | |
Married Couple | 3,862 | 28,969 | 71,503 | |
Other Family | 1,034 | 8,835 | 22,617 | |
Married w/Child | 1,420 | 12,328 | 30,369 | |
Single Male w/Child | 193 | 1,071 | 3,219 | |
Single Female w/Child | 520 | 3,159 | 7,027 |
Population Change Last Two Decades - Plus Projection
2000 | % | 2010 | % | 2020 | % | 2030 | |
---|---|---|---|---|---|---|---|
Illinois | 12,419,293 | +3 | 12,830,632 | +12 | 14,316,487 | +6 | 15,138,849 |
Cook County | 5,376,741 | -3 | 5,194,675 | +10 | 5,707,832 | +5 | 5,990,243 |
Total Working Age Population:
Total Households:
Total Working Age Population:
Total Households:
Total Working Age Population:
Total Households: